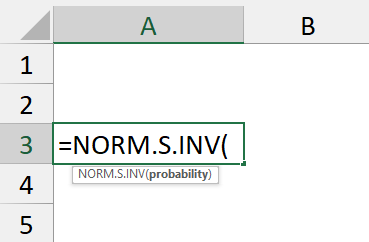
The Z critical value is the boundary value that determines whether a sample data point is statistically significant in the population. It defines the rejection area for the null hypothesis. We can easily find the Z critical value using the NORM.S.INV function in Excel.
➤ Critical value for left-tailed test: =NORM.S.INV(probability)
➤ Critical value for right-tailed test: =NORM.S.INV(1-probability)
➤ Critical values for two-tailed test:
- Left side:
=NORM.S.INV(probability/2) - Right side:
=NORM.S.INV(1-probability/2)
➤ The Z critical value divides the area where the null hypothesis is rejected and where it is accepted.
➤ The Z distribution is applicable when the population standard deviation is known and the sample size is greater than 30.
In this article, we’ll learn to calculate the Z critical values for left-tailed, right-tailed, and two-tailed tests using the NORM.S.INV function in Excel. In addition, we’ll also explain the significance of the Z critical values.
Key Terms to Know Before Finding Z Critical Value
Test Statistic
A test statistic is calculated from the sample population. It determines whether to reject the null hypothesis or not.
Critical Value
The critical value or Z critical value is the point that divides the region where the null hypothesis is rejected and the region where it is accepted. If a test statistic exceeds the critical value then we can reject the null hypothesis. If the population standard deviation is known and sample size is more than 30 then we calculate the critical Z value.
Significance Level
The significance level (α) measures how strong the evidence is in the sample before the null hypothesis is rejected and the test is considered statistically significant. To calculate the critical value we need to set a suitable significance level beforehand.
Left-Tailed Test
The left-tailed test has one acceptance region and one rejection region. So there will be one critical value to define the regions. We’ve set the significance level (α) at 0.1.
The formula for calculating the left-tailed Z critical values is as follows:
=NORM.S.INV(0.1)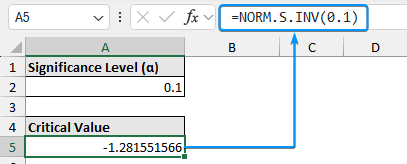
This means the result of the hypothesis test is significant if the test statistic is less than the critical value of -1.2816.
Right-Tailed Test
The right-tailed test also has one critical value and we’ve set the significance level (α) at 0.1.
The formula for calculating the right-tailed Z critical values is given below:
=NORM.S.INV(1-0.1)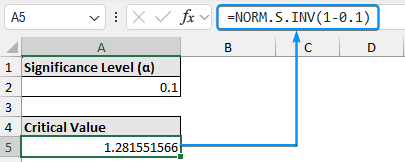
Therefore the result of the hypothesis test is significant if the test statistic is greater than the critical value of 1.2816.
Two-Tailed Test
The two-tailed test has one acceptance region and two rejection regions. Hence we’ll need two critical values to define these regions. Since there are two rejection regions, we need to divide our significance level by two. Each rejection region has a probability of α / 2, so the total probability equals the significance level.
The Z critical value for the left side:
=NORM.S.INV(0.05/2)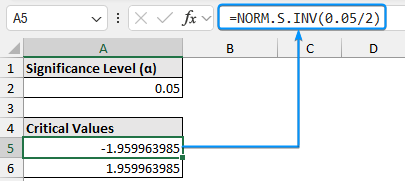
The Z critical value for the right side:
=NORM.S.INV(1-0.05/2)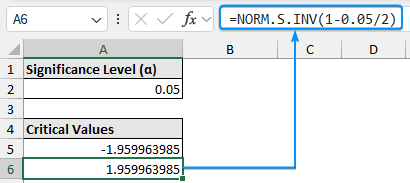
The test statistic is significant if it’s less than -1.96 or greater than 1.96.
FAQ
How to use the Z critical value table?
Identify the type of test: one-tailed or two-tailed. Select the significance level (α). Lookup the corresponding Z value from the table.
When do we use the Z distribution?
The Z distribution is used when the population standard deviation is known and the sample size exceeds 30.
What is the critical value of 95% confidence level?
The Z critical value for the one-tailed test is 1.65 and for the two-tailed test is 1.96.
What is the Z score?
The Z score represents the number of standard deviations a data point is located from the mean value.
What is the difference between Z critical value and Z score?
The Z score standardizes a data point to be compared with the standard normal distribution. The Z critical value is the boundary for rejecting the null hypothesis.
How to construct a confidence interval in Excel?
Calculate the confidence value: CONFIDENCE.NORM(alpha,standard_dev,size). The confidence interval will be CI = mean ± confidence value.
Wrapping Up
In this tutorial, we’ve learned how to find Z critical value for the left-tailed, right-tailed, and two-tailed tests using the NORM.S.INV function in Excel. Moreover, we discussed the significance of the Z critical values. Feel free to download the practice file and let us know your experience.