The unknown value in a graph refers to the non-existent values in the source. Finding an unknown value in an Excel graph requires the equation of the trendline.
The goal of every form of data analysis is to predict future or non-existent values. Discovering missing data points can reveal trends and existing patterns. In Excel, we can find the equation of a trendline for data points. The equations can then be used to find any unknown values that follow the trend.
To find an unknown value on the Excel graph,
➤ Insert a scatter plot from the data points.
➤ Add a trendline to the chart.
➤ Open the Format Trendline pane and check the option to display the equation on the graph.
➤ Use the equation to solve for the unknown value.
In this tutorial, we’ll go through how to use the trendline equation and visual estimation to find an unknown value on an Excel graph.
Download Practice WorkbookQuick Video Tutorial: Find Unknown Value from Excel Graph
Concept of Finding Unknown Values in a Chart
Finding an “unknown value” indicates finding missing data that is not plotted in a chart or in the source explicitly. They are reasoned based on the existing data or derived from the relationship between the variables. The process often involves estimation and calculation.
Essentially, you’re using the known data to deduce a missing piece of information.
How Excel Graphs Help to Find Unknown Values
Excel has the Trendlines and Equations feature to plot data points and find out the relations between them.
From trendlines, you can:
- Identify a missing “Y-value” for an X that is within the trendline.
- Or, extend the trendline and visually estimate values.
Excel can also generate equations. The equations can then be used to calculate any unknown values with greater precision.
Steps to Find an Unknown Value on an Excel Graph
There are two methods to find an unknown value on a graph: visually estimate it and use the trendline equation.
The visual method often relies on subjectivity. However, it is quick and convenient. For more accurate measurement, we are focusing on the equation to find the unknown value on the Excel graph.
Before we start, this is our dataset for the demonstration. It contains data on ice cream sales based on different days’ temperatures.
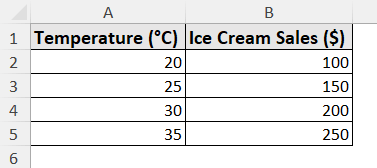
We want to find or forecast an ice cream sale for another day with a different temperature that is not in this data.
Here is how we can find the unknown value using an Excel graph:
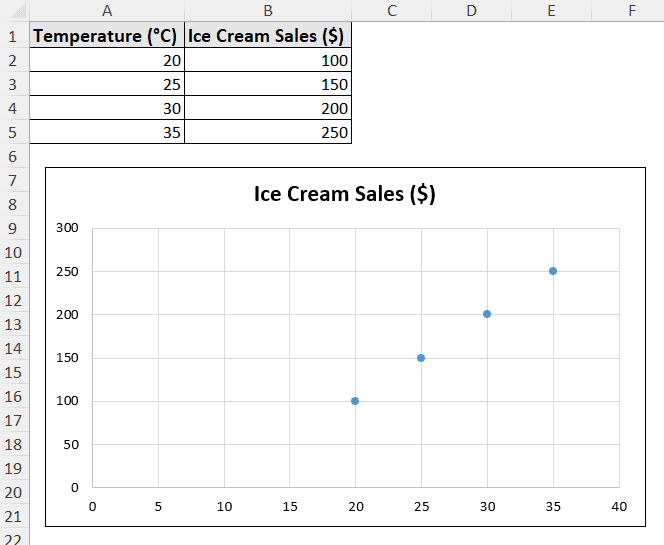
Step 1: Plot a Chart
Not all charts can contain a trendline in Excel. For simplicity, we are choosing to plot a scatter chart.
➤ Select the data source (range A1:B5).
➤ Go to Insert >> Charts (group) >> Scatter.
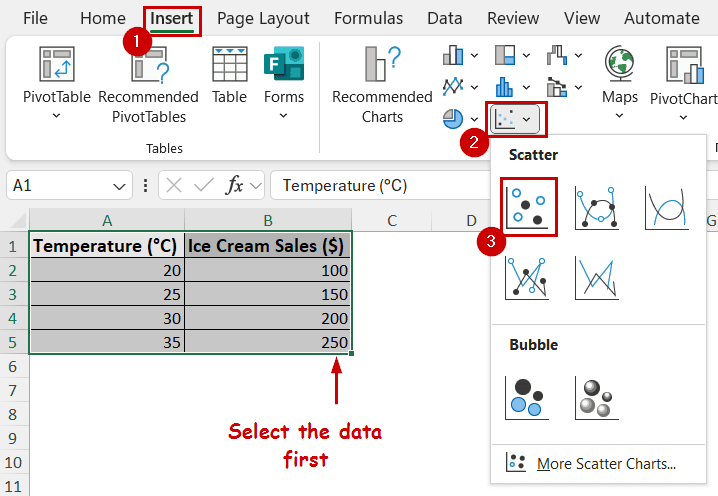
The chart will be available on the sheet.
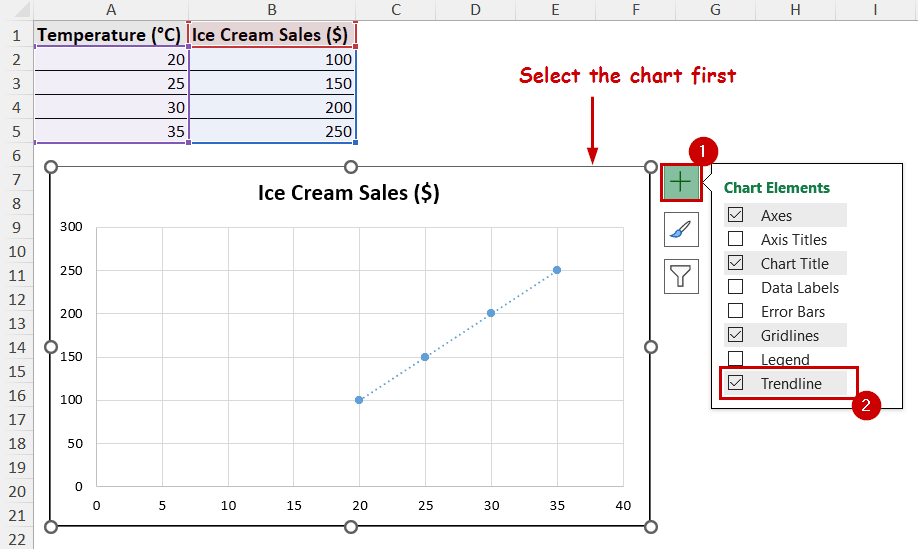
Step 2: Insert a Trendline
To insert a trendline, follow these steps:
➤ Select the chart.
➤ Go to Chart Elements >> check Trendline.
Step 3: Display the Equation
Next, we need to find out the equation of the trendline. Excel has the option to display the trendline equation on the chart.
To display the equation,
➤ Double-click on the trendline. This will open the Format Trendline pane.
➤ Under Trendline Options, check the Display Equation on chart option.
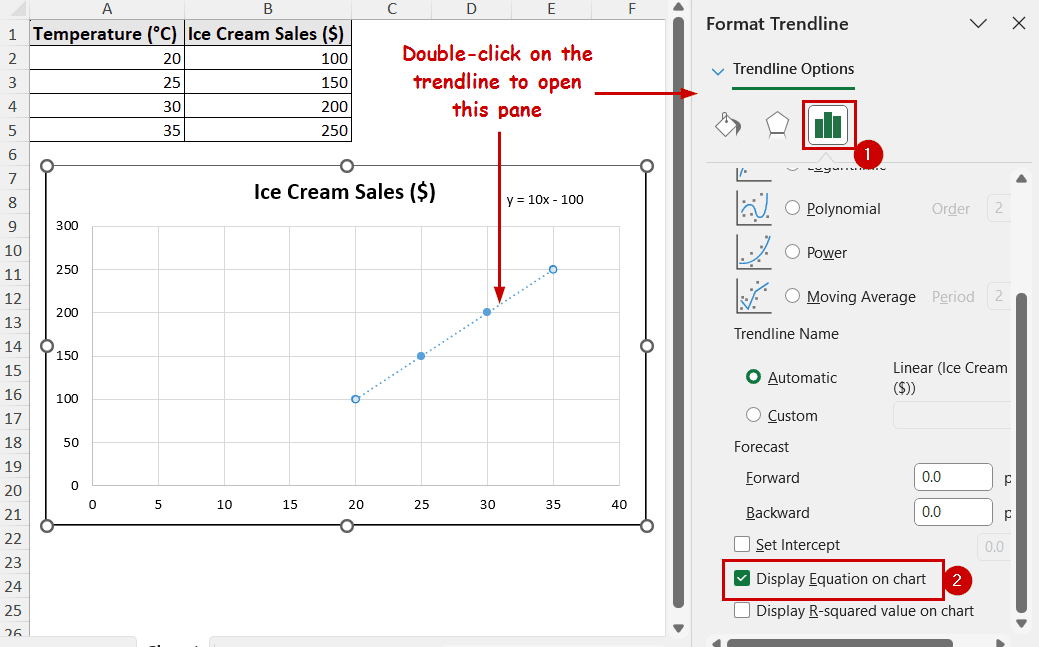
The equation will be shown on the graph. We will use this equation to find the unknown value.

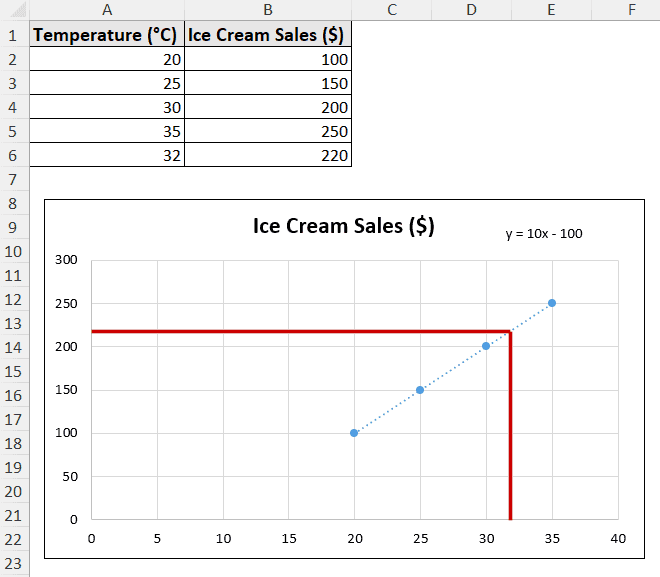
Step 4: Finding the Unknown Value from the Equation
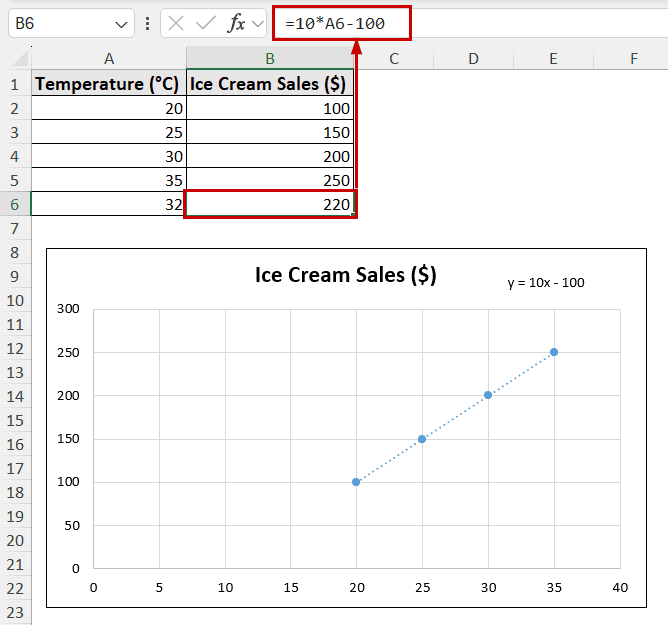
The equation here is y=10x-100
Let’s say we want to find a y-value (ice cream sales) for an x-value (temperature) of 32 degrees.
Mathematically, the calculation would be y=10(32)-100 = 220.
In the sheet, x-values are in the A column and y-values are in B column. So, the calculation in Excel would be:
➤ Insert the x-value in a cell (A6).
➤ Insert the following formula:
=10*A6-100
This process lets you easily find the unknown value from the Excel graph.
Using Graph to Visually Estimate Unknown Values
Although this method can be somewhat imperfect, this is a quick way to get an idea of the unknown value.
From the trendline we have plotted previously, we have defined values of 30 and 35. If we imagine a 2/5th point between them, we can assume it would be 32. The intersection of the vertical line from 32 and the trendline will indicate the y-value (ice cream sales) at 32 degree celsius.
This is a quick way to base an estimate on trends. It is also good for qualitative insights where accurate measurements aren’t necessary. However, the potential for bias and limited accuracy make this process somewhat unreliable. The bias is even higher when extrapolating beyond the data points (e.g. at an x value of 38 in this example).
Using Functions to Find an Unknown Value in Excel
TREND and FORECAST functions can find an unknown y-value based on existing x and y values.
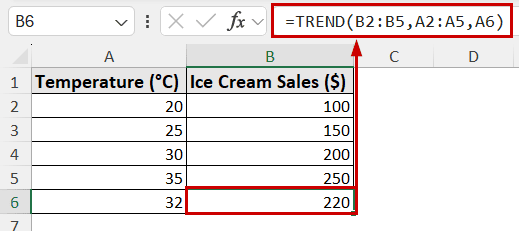
The TREND function:
➤ Use the following formula in an empty cell to find the unknown value:
=TREND(B2:B5,A2:A5,A6)
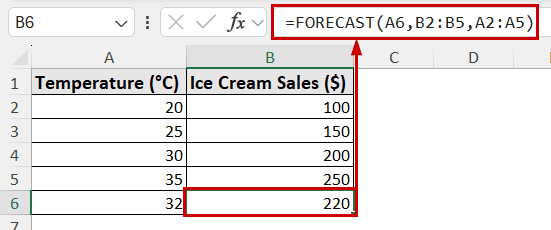
The FORECAST Function:
➤ Use the FORECAST formula in the following way:
=FORECAST(A6,B2:B5,A2:A5)
FAQ
How do I determine which trendline type to use in Excel?
Use linear trendlines for a straight-line pattern, exponential for an increasingly higher rate of rise or fall, polynomials for fluctuations, logarithmic for diminishing returns, and power trendlines for a proportional growth or decrease.
What does the R-squared value mean when finding unknown values?
The R-squared value indicates how well a trendline fits the data from the source. Usually, the value will fall between 0 to 1. The closer it is to 1, the closer the trendline is to match data points.
How accurate are predictions based on Excel trendlines?
If you follow the equation route (with a high R-squared value), the predictions will be accurate. However, the visual method won’t be as accurate. If the trendline has a R-squared value, it means you are calculating with the wrong equation and it won’t give accurate results either.
The option for R-squared value is also available in the Format Trendline pane. It is under the option to display equations.
Can I find an unknown value without adding a trendline to my graph?
You can use the TREND and FORECAST functions to find any unknown values. Excel will do the calculations of finding relations and predicting values for you. However, both functions need a high range of data to yield accurate results.
Conclusion
In this tutorial, we have used the trendline equation to find an unknown value using an Excel graph. We have also demonstrated how to use visual estimations to find unknown values from graphs. Besides, we have also demonstrated the TREND and FORECAST functions that can find unknown values without the help of charts in Excel.
Feel free to download the practice file and let us know about your feedback.