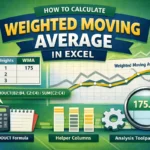
In the financial market, the exponential moving average is a commonly used calculation to detect buying and selling opportunities. These days, recent prices usually affect the market more than regular average prices. In this article, we will learn how to calculate an exponential moving average in excel with a few simple steps.
➤ Calculate the moving average of your desired timeframe
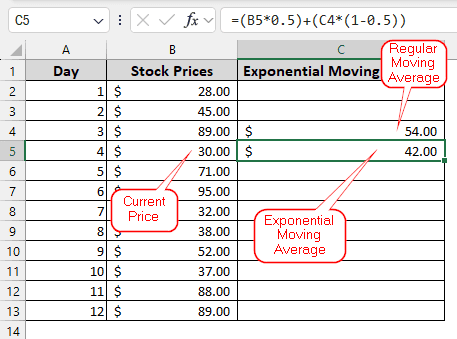
➤ Use this formula:
=(B5*0.5)+(C4*(1-0.5))
➤ Replace B5 with the latest price, 5 with the smoothing factor, C4 with the last exponential moving average (regular moving average for the first one)
If you are doing this calculation for the first time, those takeaways might be confusing for you. Do not worry, because we will explain it to you in detail. So, put your attention here, and read the whole article to learn about the exponential moving average.
What is Exponential Moving Average?
In general, a moving average is used to calculate the average of prices in the last X number of days. For example, if you have price updates every day, you can calculate the prices of the last 5 days to understand the price trends. Exponential Moving Average does a similar thing, but it values the latest prices the most. Using a smoothing factor, the average is made more or less sensitive to the prices, so that the fluctuations can be monitored properly. The formula for calculating the exponential moving average is:
EMA = Smoothing Factor * Current Price + Previous EMA * (1-Smoothing Factor)
The following formula determines the smoothing factor:
Smoothing Factor = 2 / (Number of periods + 1)
Calculating Exponential Moving Average in Excel
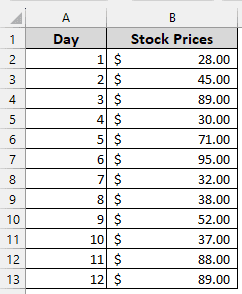
In the following dataset, we have the stock prices for a few days. To get a better picture of the market, it is required to calculate the exponential moving average.
Follow the steps below to calculate the exponential moving average:
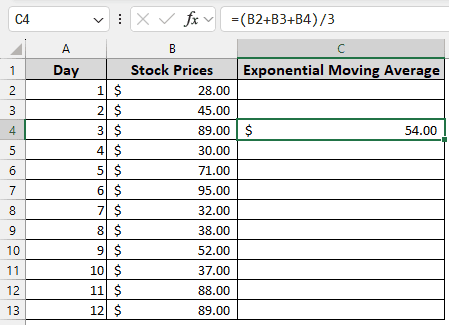
➤ Take a helper column (C) on the right. Now, enter this formula in the C4
=(B2+B3+B4)/3
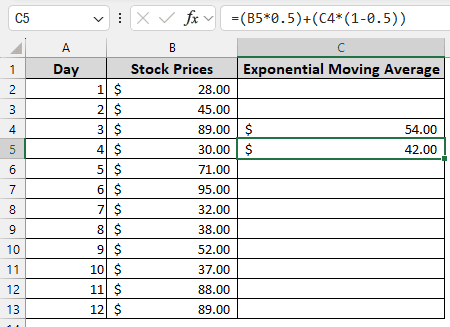
➤ Go to the cell below (C5), and write this formula:
=(B5*0.5)+(C4*(1-0.5))
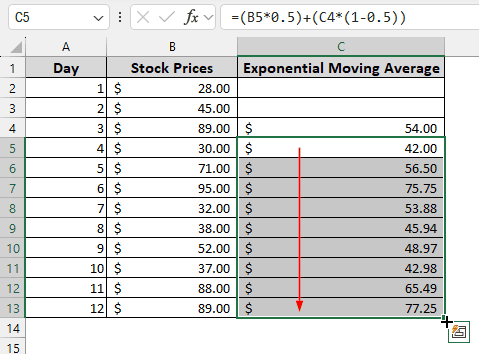
➤ Now, autofill the rest of the cells. As the fill references the last cell (C5, C6, and so on), the rest of the averages will be calculated as the exponential moving average.
Frequently Asked Questions
Which EMA is most accurate?
It will depend on the business. However, 9-10 days are usually used for calculating the exponential moving average.
Which is better EMA or SMA?
EMA reacts quickly to price changes, while SMA takes some time to catch up. Which one is better would depend on your business.
How to read EMA lines?
If the EMA is lower than the current stock price, it might provide an indicator for the trader to buy more. If the EMA is higher, it might prompt selling as the market might crash soon.
Which indicator has the highest accuracy?
Different stocks might require different indicators. However, the Moving Average Convergence Divergence (MACD) is usually what most investors use.
Which indicator works best with EMA?
You can use MACD or Relative Strength Index (RSI) with EMA.
Wrapping Up
In this article, we learned how to calculate exponential moving averages in Excel. The practice file we used in the article can be downloaded for your exercise. Feel free to leave a comment to let us know your thoughts.