Creating a bin range in Excel helps you group continuous numeric data into intervals, making it easier to interpret trends, build histograms, or summarize large datasets. Whether you’re analyzing test scores, age groups, or income brackets, binning data allows for clearer insights.
In this article, we’ll learn several ways to create a bin range in Excel, both manually and automatically using built-in tools, formulas, and advanced features like the Data Analysis ToolPak. Let’s get started.
Steps to create a bin range in excel:
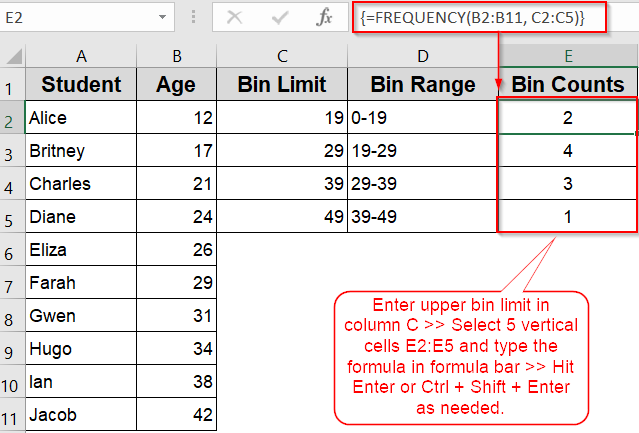
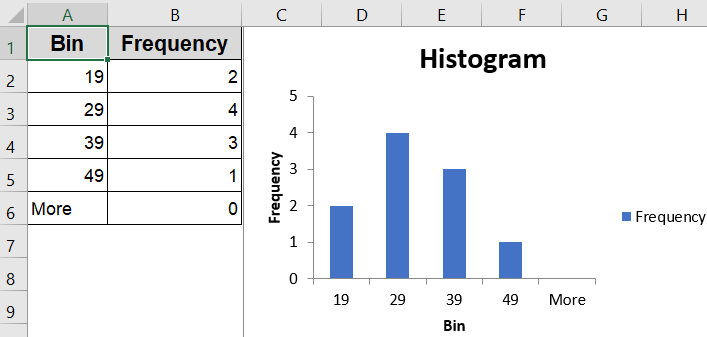
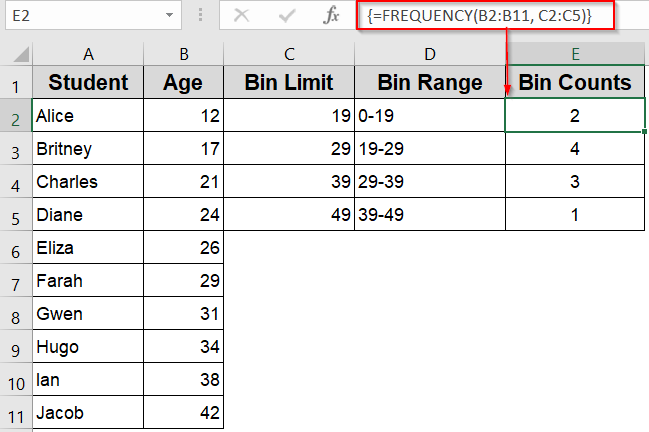
➤ Create a column with bin upper limits from C2:C5 (e.g., 19, 29, 39, 49).
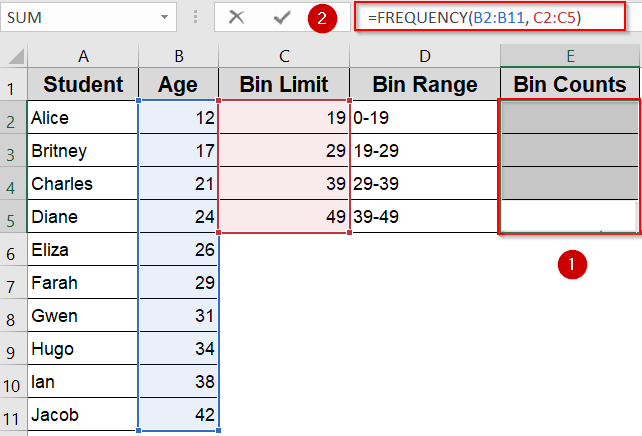
➤ Select cells E2:E5 and type this formula in the Formula Bar:
=FREQUENCY(B2:B11, C2:C5)
➤ Press Ctrl + Shift + Enter (for array entry). Excel will output the count of values in each bin.
Define a Bin Range Manually and Use the Histogram Tool (Excel 2016+)
This method lets you control exactly how data is grouped by defining your own intervals. The goal is to create a frequency distribution that shows how many students fall within age brackets like 0–19, 20–29, etc and then display this visually with a histogram chart.
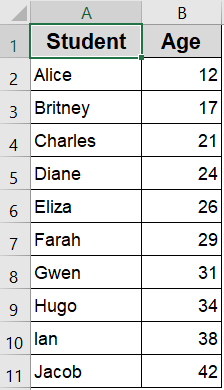
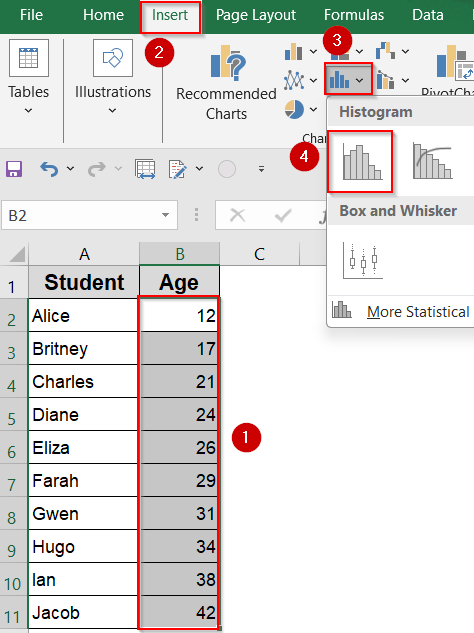
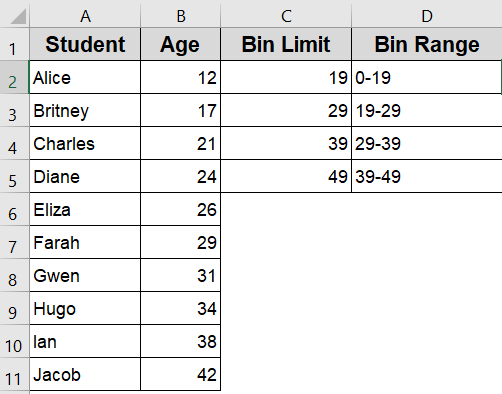
To demonstrate how bin ranges work in Excel, let’s use a simple list of student ages. Each student in column A has an associated age ranging from 12 to 42. We’ll use this data to create a histogram that groups these ages into custom-defined intervals, making it easier to visualize how many students fall within each age range.
Steps:
➤ Decide on your intervals, for example, 0–19, 20–29, 30–39, 40–49 and list the upper limits in a separate column C such as 19, 29, 39, 49.

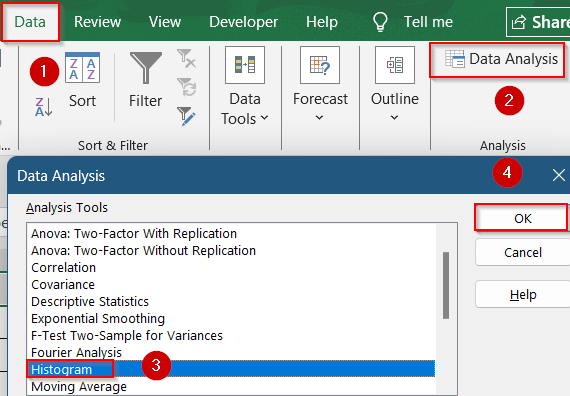
➤ Go to the Data tab >> Click Data Analysis (enable the ToolPak if needed).
➤ Choose Histogram >> Click OK.
➤ In the dialog box, set your Input Range to the Age column (e.g., B2:B11) and Bin Range to your custom intervals (e.g., C2:C5).
➤ Choose an Output Range or check “New Worksheet Ply” >> Check box for Chart Output >> Click OK.
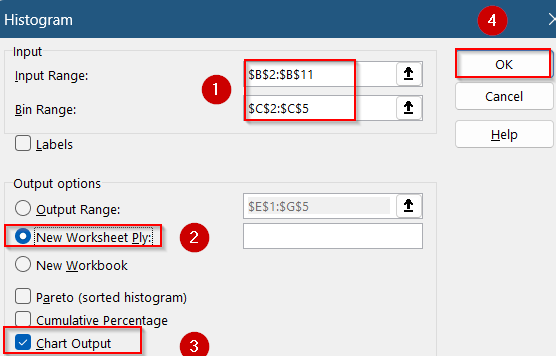
➤ Excel will generate a frequency table and histogram using your defined bins in a new sheet.
This method gives full control over how your data is grouped and is ideal when precise intervals are required.
Use Excel’s Built-in Histogram Chart for Automatic Binning
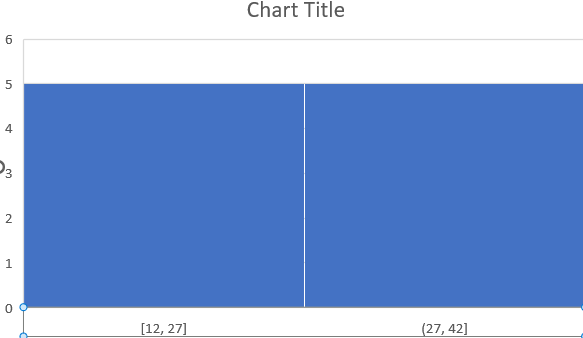
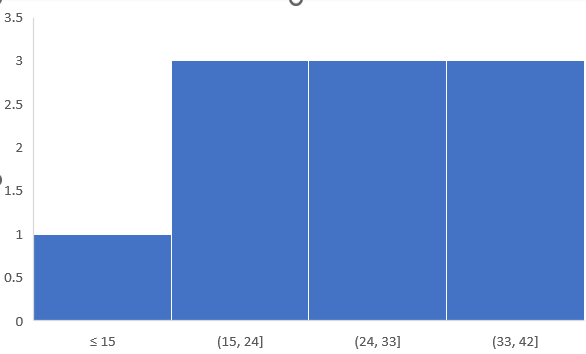
If you don’t need precise control over your bin intervals, Excel can automatically group your numeric data using a built-in histogram chart. This method is ideal for quick analysis or visual exploration. The chart will show how your Age values are distributed across ranges, making it easy to detect patterns, skew, or clusters in the data at a glance.
Steps:
➤ Select the Age values (B2:B11) without including the headers.
➤ Go to the Insert tab >> Click Insert Statistic Chart >> Choose Histogram.
➤ Excel will automatically group your data into bins based on its distribution.
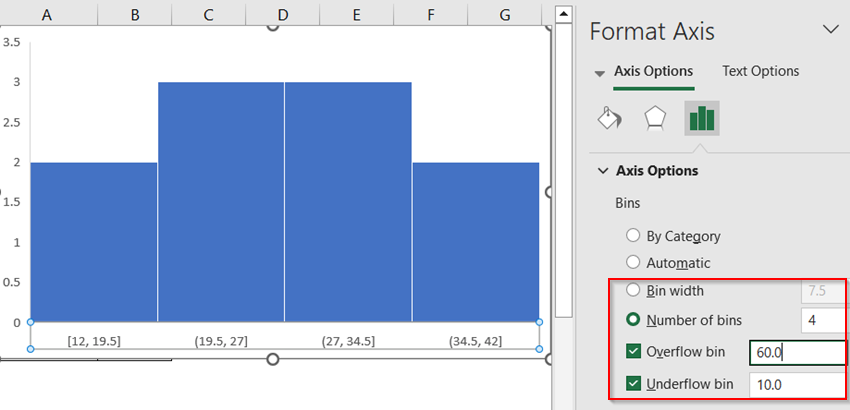
➤ To adjust bins, right-click the horizontal axis >> Choose Format Axis.
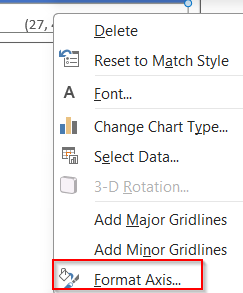
➤ Under Axis Options, change the Bin Width or set the Number of Bins to customize grouping.
➤ You can also add Overflow Bin and Underflow Bin options to manage extreme values.
This method is quick and works well when you’re exploring data or need a fast visualization.
Insert the FREQUENCY Function to Create Bins and Count Data
If you want a purely formula-based approach to generate bin counts without inserting a chart, Excel’s FREQUENCY function is a perfect fit. It calculates how many values fall into specified intervals and gives you a clean count for each bin. This method is useful for creating structured data summaries or when working in Excel versions that don’t support built-in histogram charts.
Steps:
➤ Create a column with bin upper limits from C2:C5 (e.g., 19, 29, 39, 49).
➤ Select cells E2:E5 and type this formula in the Formula Bar:
=FREQUENCY(B2:B11, C2:C5)
➤ Press Ctrl + Shift + Enter (for array entry). Excel will output the count of values in each bin.
This formula-based method is great for structured binning without visual charts and works in all Excel versions.
Frequently Asked Questions
What is a bin range in Excel?
A bin range is a set of numeric limits that define how Excel groups continuous data into intervals when creating histograms, allowing you to analyze how values are distributed across defined categories.
Can I change the number of bins after inserting a histogram?
Yes, you can customize bins by right-clicking the chart’s horizontal axis, choosing Format Axis, and then adjusting the bin width or entering the exact number of bins you want for more accurate grouping.
How do I enable the Data Analysis ToolPak?
To activate it, go to File tab >> Options >> Add-ins, then choose Excel Add-ins from the dropdown, click Go, check the box for Analysis ToolPak, and confirm by clicking OK to enable it.
What happens if my data goes beyond the last bin?
If your data exceeds the last defined bin, Excel places those values into an overflow bin automatically (in FREQUENCY formulas or Format Axis options), ensuring no data points are excluded from the histogram.
Wrapping Up
In this tutorial, we explored multiple ways to define and troubleshoot bin ranges in Excel histograms. From using the built-in chart option for quick visualizations to leveraging the Data Analysis ToolPak for precise grouping and even creating custom bins with formulas, you now have a complete toolkit for managing histogram bins effectively. Feel free to download the practice file and share your feedback.

