A trendline is a line that represents the general direction of the data. To extend a trendline in Excel, we need to increase the forward, backward, or both values of the forecast.
It simplifies the overall pattern. Usually, it falls between the starting and ending points of the distribution. Sometimes, an output for a non-existent point is necessary for either forecasting or predicting past values. In those cases, extending the trendline is necessary.
To extend a trendline in Excel,
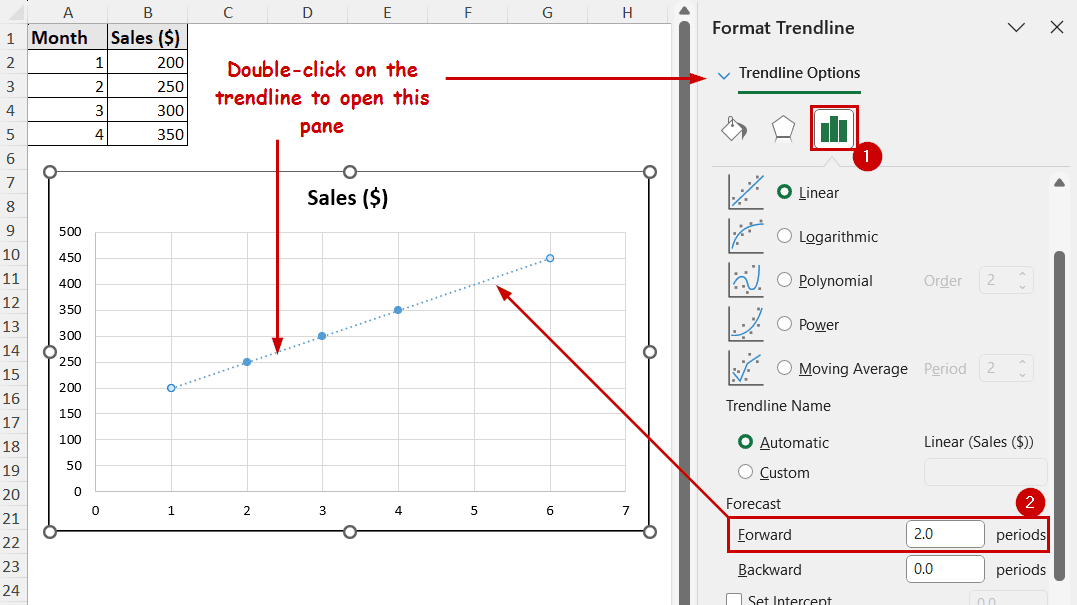
➤ Double-click on a trendline to open the Format Trendline pane.
➤ Insert a Forward or Backward value under Forecast to extend the trendline up to that point.
Excel has a forecasting option in the Format Trendline pane. We can also manually calculate values and represent them in the chart to extend the trendline in both directions.
In this tutorial, we’ll explore both of these methods to extend the trendline in Excel.
Download Practice WorkbookUsing Forward and Backward Forecasting
The Forecast feature in Excel is the quickest and easiest way to extend the trendline. It is directly tied to the type of trendline (linear, exponential, etc.). You can forecast both forward (into the future) and backward (to predict past values).
The feature is available in the Format Trendline pane.
Before starting the demonstration, let’s introduce our data. It contains sales every month.
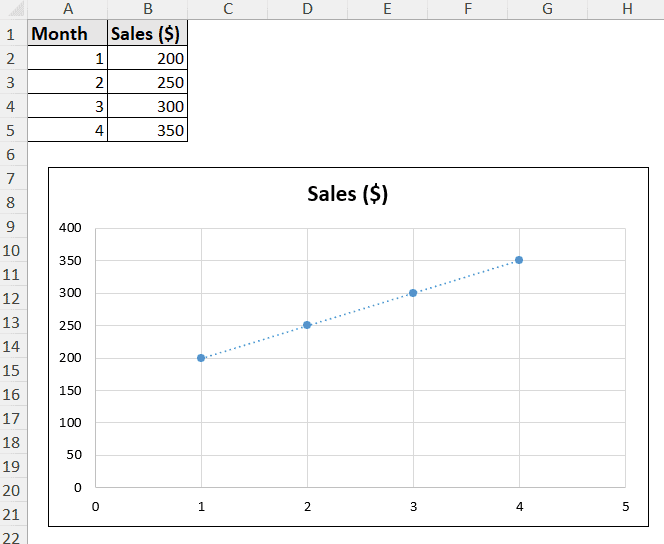
We have plotted it in a scatter chart with a trendline. Now, we are going to extend the trendline.
Steps:
➤ Double-click on the trendline to open the Format Trendline pane.
➤ Change the Forward value under Forecast to the desired unit you want to extend into the future. This is available under the Trendline Options.
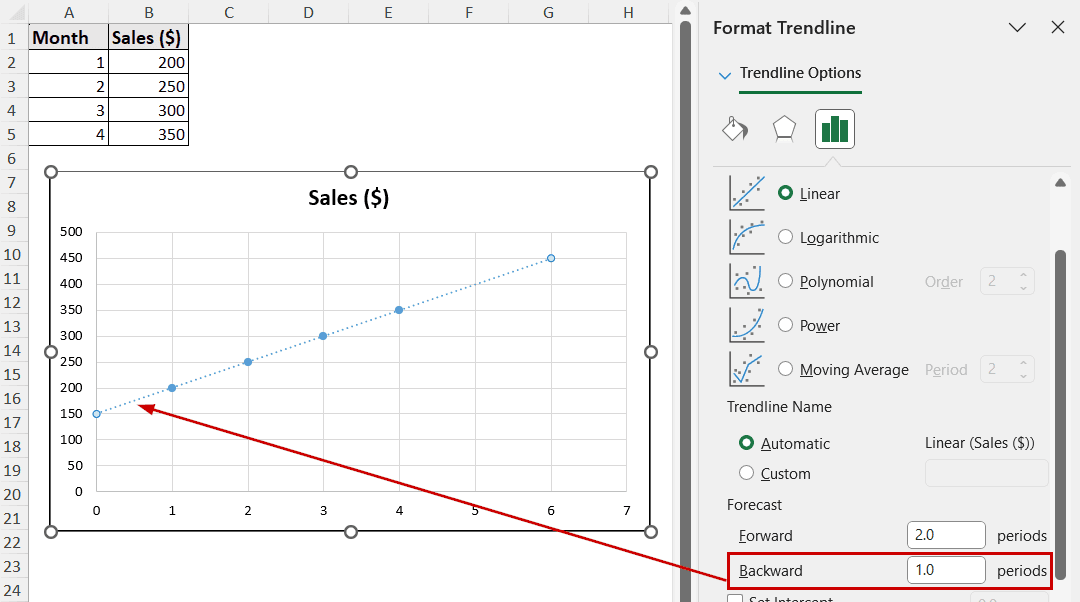
➤ Or, extend the trendline into the past by entering a value in the Backward field.
Using Trendline Equation
Another unconventional yet effective way to extend the trendline is to use the trendline equation.
Although this method would be too much work for general forecasting in the near future, the method is helpful in predicting something that isn’t limited to chart boundaries.
For this method to work, the data source should be in a table. This is to update the chart automatically based on the source.
Steps:
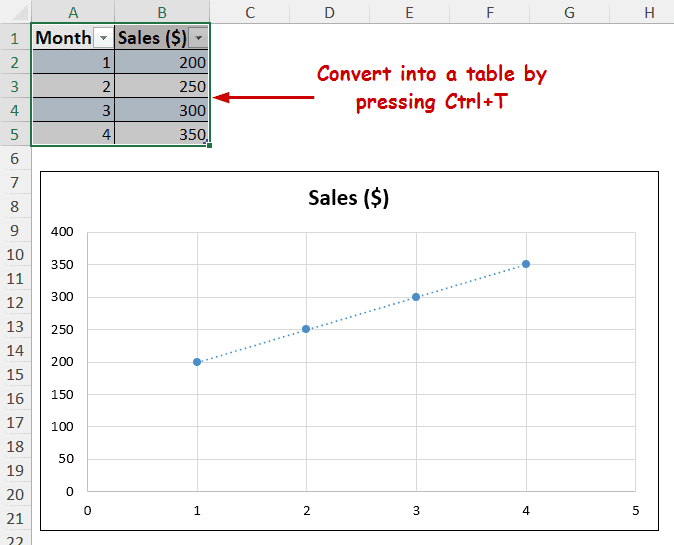
➤ Select a cell in the data source and press Ctrl+T to convert it into a table.
➤ Now, double-click on the trendline to open the Format Trendline pane.
➤ Under the Trendline Options, check the Display Equation on chart option.
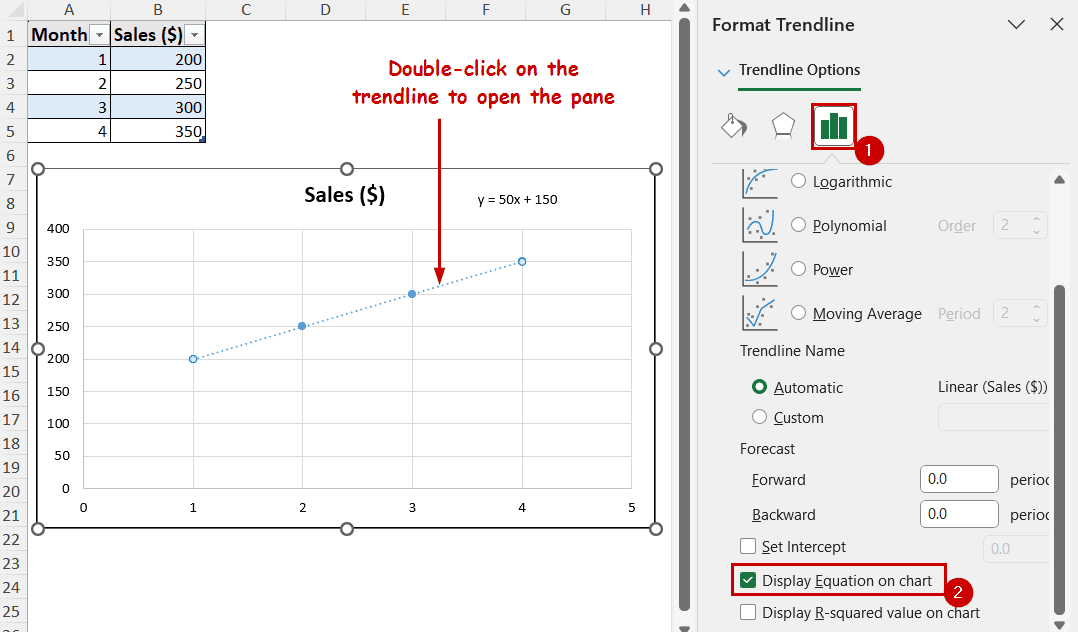
The equation will be available on the chart.

➤ Now use this equation for the y-values in the table for future x-values.
For example, we want to forecast for the 5th month. So, we have inserted 5 in A6 and the following formula in B6.
=50*A6+150
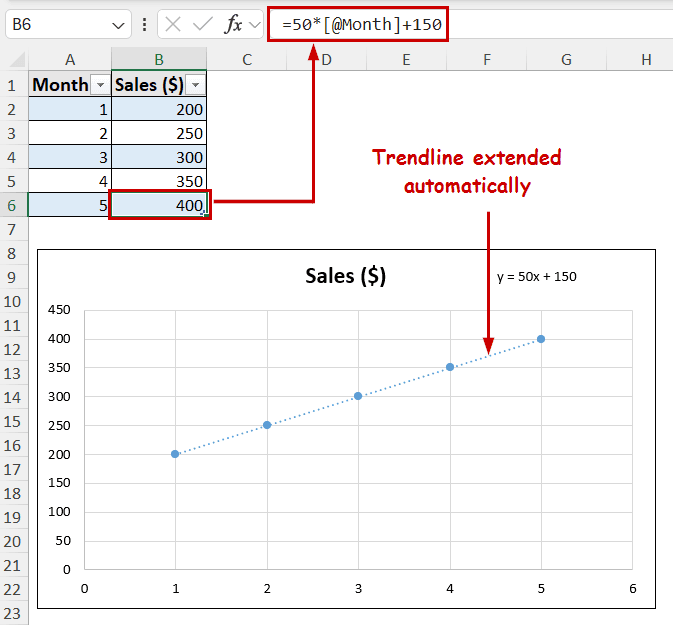
Since the data source was converted into a table, a reference from the A column was picked automatically as a month. The data source of the chart automatically extended to fit the extra data into the chart. Hence, the extension of the trendline.
Tips to Extend Trendlines Accurately
We have used a simplified linear example to demonstrate the methods. However, the real data would be much more complex to work with. So, it is important to find the correct trendline and either forecast or calculate based on that trendline’s equation.
Here are some additional tips for accurate trendline extensions:
- Make sure the data is clean and well-organized before projecting it into a chart.
- Check the R-squared value of a trendline to see if it’s a good fit. The option is available in the Trendline Options of the Format Trendline pane. The closer it is to 1, the more accurate the equation is in representing the data points.
FAQ
Can I extend a trendline for multiple datasets at once?
As of the latest version of Excel, it doesn’t support extending trendlines for multiple datasets. You can add individual trendlines for different series and forecast or calculate separately.
Why does my extended trendline not match my expectations?
The most common cause of extended trendlines not matching expectations is incorrect trendlines or outliers in the data. Check the R-squared value to find out if the trendline type is correct. Excessive extrapolation that is too far beyond the range can also lead to unrealistic predictions.
Is there a limit to how far I can extend a trendline?
While there aren’t any limits or restrictions on how far you can extend the trendline, extending it too far results in less reliable predictions. Keep in mind, Excel operates under the assumption of continuity while extending trendlines. Oftentimes, trendlines also oversimplify datasets with multiple variables or non-linear relationships.
Conclusion
We have covered the forecasting and manual methods to extend a trendline in Excel. Use the forward and backward forecasting options to extend the trendline into the future or the past. Be sure to format the data source into a table if you use equations to manually extend the trendline.
Feel free to download the workbook and give us your feedback.