The slope is a measurement of steepness and direction. It can be the steepness of a line or the steepness of the tangent (for a point in a curve). Finding the slope of a trendline in Excel is useful for analyzing trends, such as growth, efficiency, or velocity.
To find the slope of a trendline in Excel, use the steps below:
➤ Enter the formula: =SLOPE(y-values,x-values)
➤ Replace “y-values” with the range containing the Y-axis values.
➤ Replace “x-values” with the range containing the X-axis values.

In this article, we’ll cover how to find the slope of a trendline in Excel using the chart option to create an equation for slope, the SLOPE function, and manually calculate the slope from values.
Download Practice WorkbookQuick Video Tutorial: Find Slope of Trendline in Excel
Understanding the Slope of a Trendline
The slope is the change of y-values with respect to x-values. In other words, it measures how quickly y changes when x changes.
Mathematically, the slope (m) is measured by:
(x1,y1) and (x2,y2) are two different points in the line.
The slope can be positive, negative, zero, or undefined.
➤ A positive slope means the change is uphill. (y increases when x increases)
➤ The negative slope indicates a downhill change. (y decreases when x increases)
➤ Horizontal lines have zero slope. (y doesn’t change when x changes)
➤ Vertical lines have an undefined slope. (since there is no change in x)
With that being said, most of the slope fundamentals apply to straight lines. For curved trendlines, the slope value changes with each point on the trendline. It indicates that the change of y varies at different x values.
Displaying Equation on Chart
Excel has an option to display the equation on a chart.
If you plot the trendline on a chart with data, you can enable this option to view the equation. The slope is available in the equation.
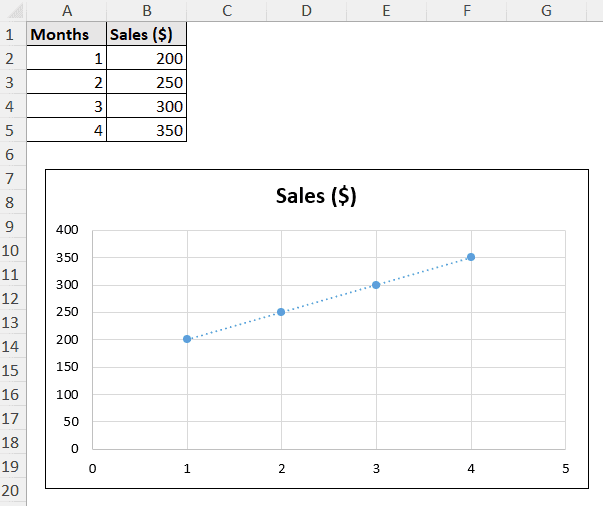
Note that this is only suitable for linear equations. So, we are demonstrating it for a linear trend. Our data here consists of monthly sales for a sample shop.
Steps:
➤ Double-click on the trendline to open the Format Trendline pane.
➤ Under the Trendline Options, select Display Equation on chart.

➤ Take note of the coefficient of x for the slope value.

The equation shows y=50x+150. So, our slope for the trendline is 50.
Using SLOPE Function
This is the quickest way to find out the slope of a trendline in Excel as it doesn’t require creating any chart.
Instead, the SLOPE function can calculate the slope for you without any equations. This method also requires the data to have a linear trendline. Otherwise, the slope value gets messed up.
The SLOPE function only needs the x and y values.
Steps:
➤ Enter the following formula in the output cell (B7).
=SLOPE(B2:B5,A2:A5)
Calculating Slope Manually
This is an unconventional method for calculating the slope in Excel. However, it is useful to understand the underlying concept.
When the value of the slope changes (in a curved trendline), you can use this method to find the slope at a particular point.
You don’t need to use data points either; any two values of a straight trendline will do the job.
The goal is to go back to the basics and calculate the slope from the x and y values.
Steps:
➤ Use the following formula in the output cell (B7).
=(B4-B3)/(A4-A3)
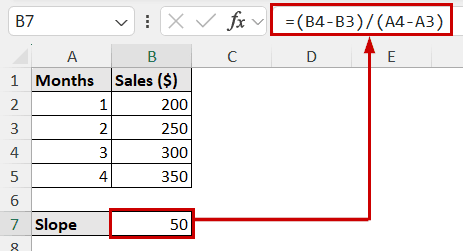
Note: We have used two points in y and the corresponding x values with the chosen y values. This is to adjust with the slope equation. The closer these y (or x) values are, the more accurate the result will be within those points in a curved trendline.
FAQ
What types of trendlines have a slope?
All trendlines can have slopes. However, the linear trendline has a defined and singular slope value. For a curved line, the slope value will fluctuate at different points.
Why is my trendline equation not displaying?
The trendline equation should display all types of trendlines. Make sure you have checked the Display Equation on chart option on the Format Trendline pane. To get rid of the formatting issues, make the equation’s font size large enough and change it to a color that doesn’t blend in with the background.
Note that the trendline option itself is available on limited types of charts. Make sure you have plotted the data in the correct type of chart to plot a trendline to begin with.
Is the slope the same as correlation in Excel?
No, slope and correlation aren’t the same. Still, the concepts are related.
The slope is the steepness of a line. Whereas, correlation tells how closely the data points cluster around a straight line.
Why do the values mismatch from SLOPE function and chart?
The value mismatch from the SLOPE function and the chart equation can be from rounding and different data ranges.
Excel rounds the slope value to fit in the display. The SLOPE function measures and displays it more precisely. For example, the SLOPE function can show the value to be 2.53729, but in the chart equation, it might be rounded to 2.5 or 2.6.
To avoid the data range error, select all the data used in the chart in the function.
Conclusion
We have used the chart equation, the SLOPE function, and the manual method to find the slope of a trendline in Excel. Displaying the equation creates a quick visual. The SLOPE function is the quickest and most precise choice. The manual calculation is good for understanding the concept or finding the slope between two close points in a curve.
Feel free to download the practice file and let us know about your feedback.