
In order to achieve the target profit, a company must calculate the break-even point prior to setting the price. In Microsoft Excel, there are a few ways to do this. In this article, we will learn how to calculate break even point in excel.
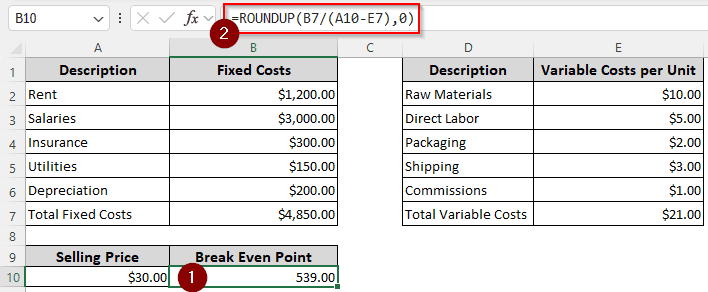
➤ Write this formula in your desired cell:
=ROUNDUP(B7/(A10-E7),0)
➤ Replace B7 with the fixed cost, A10 with the selling price, and E7 with the variable cost.
➤ Press Enter to complete the calculation.
That strategy calculated the break even point in units. However, you might want to do it in dollars as well. We believe you deserve an explanation of the method as well. In this article, we will learn three methods to calculate break even point in excel. Let’s get started.
What is Break Even Point in Finance?
A business owner who wants to make a target profit must set the price of the products first. Managers will often set a target profit for the time period, and assign the tasks accordingly to sell a definite number of products.
The break-even point is the number of product units that, when sold, the cost of doing business and the amount earned from selling the products will be the same. At the break-even point, the profit and loss of a business is zero. If the company sells fewer products than the break-even point, it will face a loss. Similarly, selling more products than the break-even point will turn the company a profit.
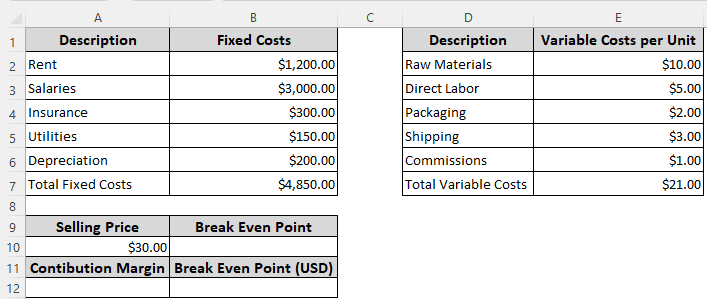
Using Contribution Margin to Calculate Break-Even Point
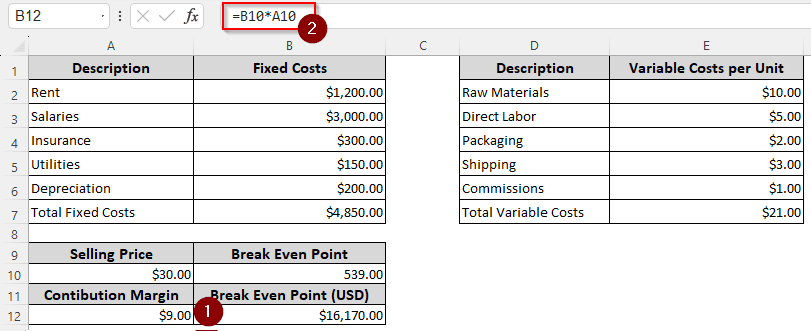
The contribution margin is the difference between the selling price and the variable cost. When we divide the fixed cost by the contribution margin, we get the break-even units. To demonstrate, we have a data set with some fixed costs, variable costs, and the selling price. Here is how to calculate the break-even point using the data:
➤ In the field of Contribution Margin, write this formula:
=A10-E7
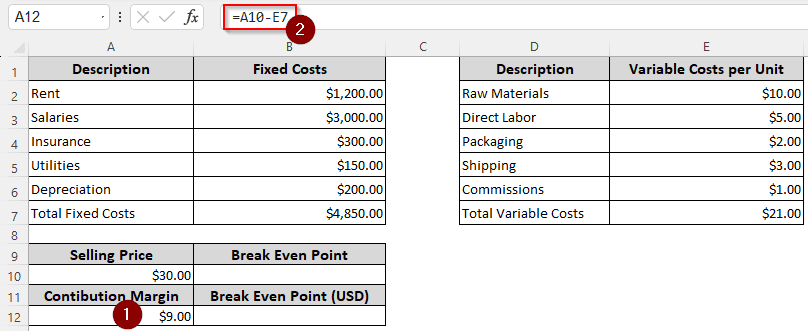
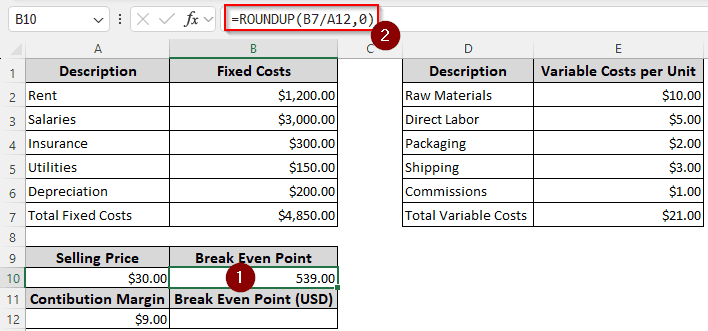
➤ In the cell of Break Even Point, write this formula:
=ROUNDUP(B7/A12,0)
➤ Now, to calculate the break-even point in dollars, write this formula:
=B10*A10
Calculating Break-Even Point Directly in Dollars
If you have already completed production, you already know the total cost of the product. However, if your production plan is still in the development stage, you might want to calculate the break-even point in dollars before diving in. In this method, instead of calculating the units first, we will directly calculate the break-even point in dollars. Follow the instructions below:
➤ Insert this formula to calculate the Contribution Margin %:
=(A10-E7)/A10
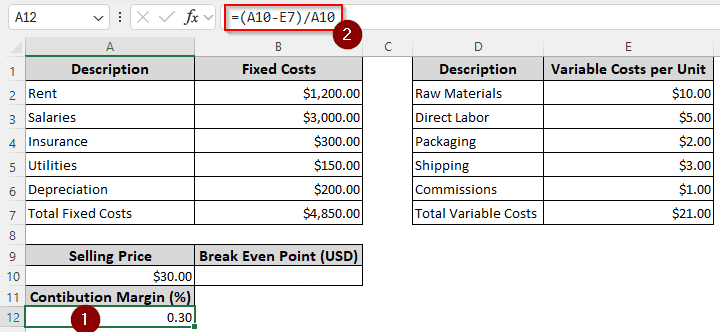
➤ Next, calculate the break-even point in dollars using this formula:
=B7/A12
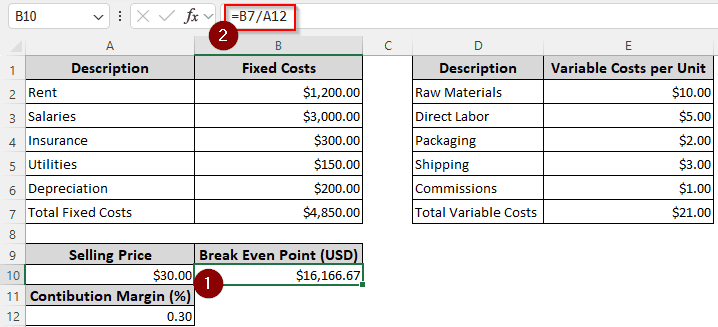
Note:
As we are purely calculating the total costs without units, we haven’t rounded up the result, which caused the amount to slightly differ from the previous method.
Finding the Break-Even Point Using Goal Seek
Microsoft Excel is able to do a lot of analysis by itself. One method is using the Goal Seek from the What-If analysis. As the profit during the break-even is zero, we can use that value to calculate the break-even point. Follow the steps below to do so:
➤ Set up an imaginary sales unit. If you have made the sales already, take the value from your journal. We are using 1000 for this calculation.
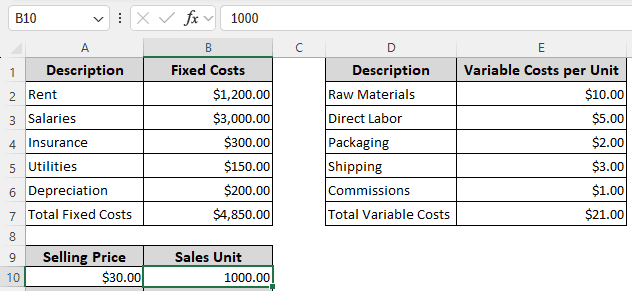
➤ Calculate the revenue using the following formula:
=A10*B10
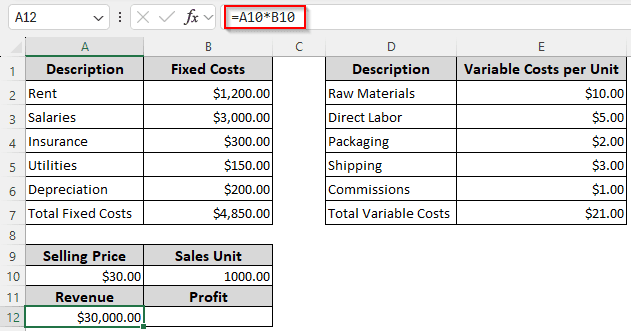
➤ Calculate the profit with this formula:
=A12-B7-(E7*B10)
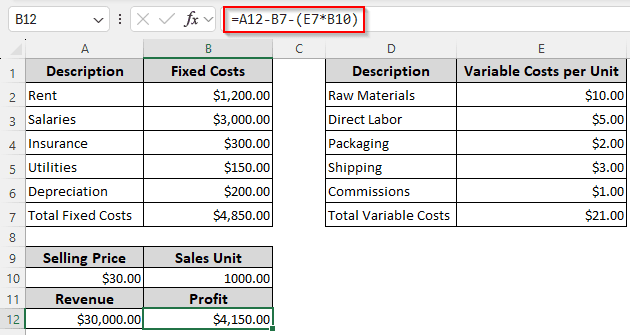
➤ At this point, we have a profit of 4150 However, while breaking even, the profit is zero. Let’s ask Microsoft Excel to do that.
➤ From the Data tab, go to the Forecast Then, head to What-If Analysis > Goal Seek.
➤ In the new window, write B12 for the Set cell, 0 for the To value, and B10 in the By changing cell edit box.
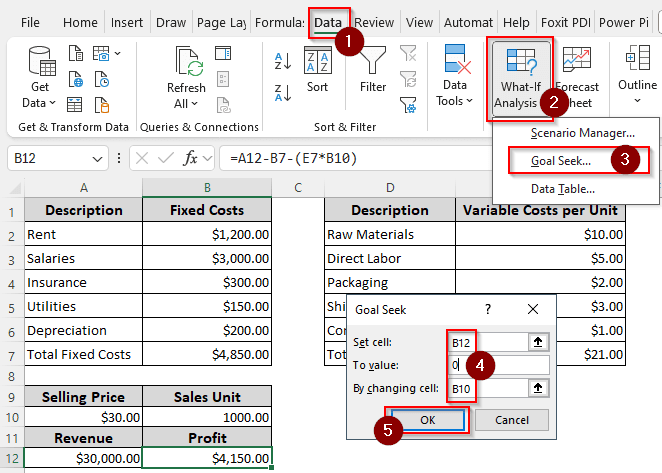
➤ Press OK and wait.
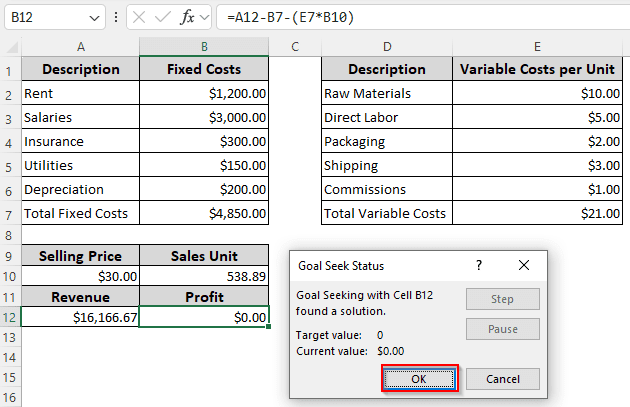
➤ In another small window, Excel will confirm the calculation has been completed. Press OK again to continue.
Building a Chart to Find the Break-Even Point
In this method, we will be using no calculation or anything. Instead, we will be creating a chart that makes it even easier for the non-accounting people to understand the break-even. To do so, we have taken a new table with various numbers of units to sell, the revenues, fixed costs, variable costs, and the total costs. Here is how to do the break-even analysis:
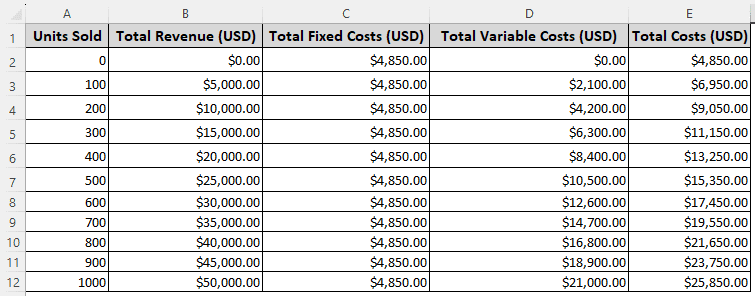
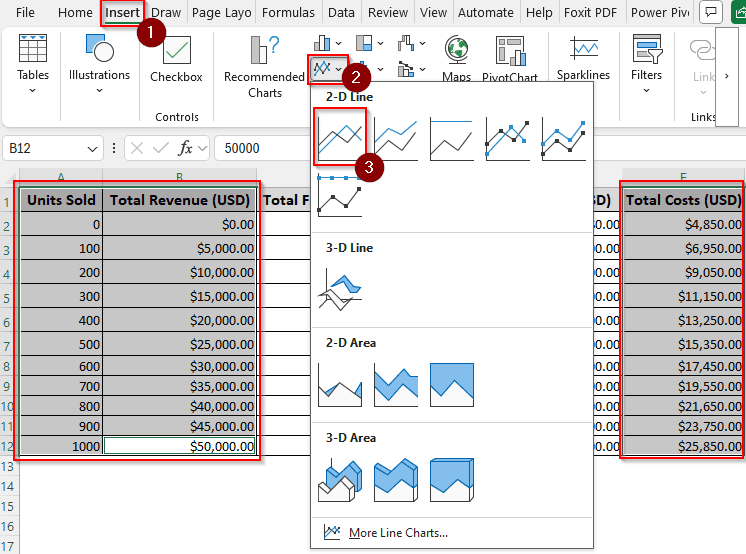
➤ Select the Units Sold, Total Revenue (USD), and Total Costs (USD) You can hold shift and drag your mouse while left-clicking to do so.
➤ Go to Insert > Charts and select the first 2-D Line chart.
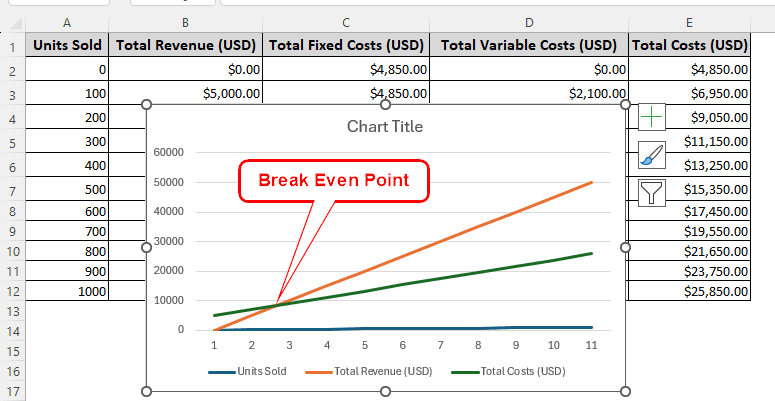
➤ In the chart, the point where the total revenue and the total costs match is the break-even point.
Frequently Asked Questions
How to calculate total cost?
The total cost can be calculated by multiplying the variable costs by the units produced and adding the fixed cost to the result. In excel, the formula can be written like the following:
=(A1*B1)+C1
Here, A1 is the variable cost per unit, B1 is the number of units, and C1 is the total fixed cost.
How to calculate margin?
Multiply the gross profit by the revenue, and multiply it by 100 to calculate the margin. Here is the formula to do so:
=(A1*B1)*100
Replace A1 with the gross profit and B1 with the revenue.
Why calculate break-even?
Before you start to make money, you must know how to cover your costs. The break-even analysis gives you a clear idea of when you will be able to get the investment back from your business so that you can focus on making a profit.
How to calculate cogs?
The costs of goods sold are basically the variable costs in a business. You can calculate COGS by adding the purchases to the beginning inventory and subtracting the ending inventory from the result. Here is the formula in excel to do so:
=(A1+B1)-C1
You need to replace A1 with the beginning inventory, B1 with the purchases, and C1 with the ending inventory.
What is a normal break-even?
It depends on the business. If you have a target profit to make, you have to set the prices so that you break even faster or slower, according to your plans.
Wrapping Up
From this tutorial, we have learned the ways we can calculate the break-even point in Excel. We hope that you won’t ever have to search how to calculate break even point in excel, because we have covered all the ways you can do that. If you have any questions regarding anything related to excel, leave your comments below, and we will get back as soon as possible.

