The key to data analysis is understanding how variables are related. In this tutorial, you will learn how to find the correlation coefficient in Excel and interpret the findings. By calculating the correlation coefficient, you can spot trends and make data driven decisions, whether you’re tracking social media engagement, evaluating channel analytics, or examining test results.
➤ Correlation coefficient signifies strength and direction of relationship between two variables. In this article, we’ll learn about the correlation coefficient and the Pearson correlation coefficient. We’ll use the CORREL and PEARSON functions to find correlation coefficient in Excel and explain our key findings.
➤ Pearson correlation coefficient measures the linear relationship between two variables.
➤ A +1 shows a perfectly positive correlation. A -1 shows a perfectly negative correlation. A 0 indicates no meaningful correlation.
➤ CORREL function: =CORREL(array1, array2)
➤ PEARSON function: =PEARSON(array1, array2)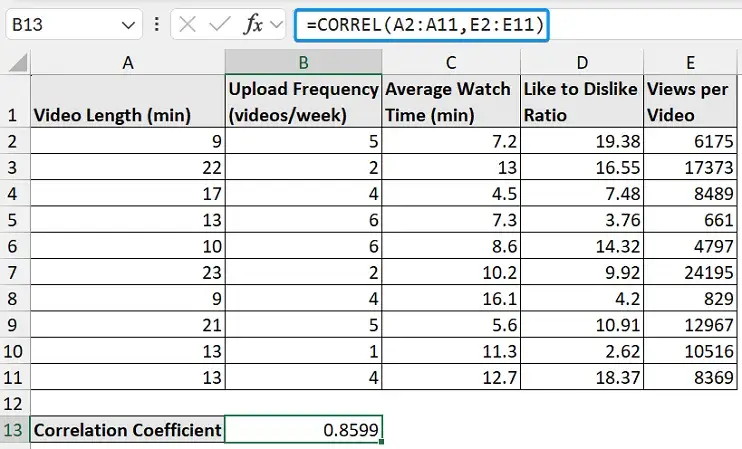
What Is Correlation in Statistics?
The correlation coefficient shows the strength and direction of the relationship between two variables. It ranges from -1 to 1:
➤ 0.90 to 1.00 (−0.90 to −1.00): Very strong positive (negative) correlation.
➤ 0.70 to 0.90 (−0.70 to −0.90): Strong positive (negative) correlation.
➤ 0.50 to 0.70 (−0.50 to −0.70): Moderate positive (negative) correlation
➤ 0.30 to 0.50 (−0.30 to −0.50): Weak positive (negative) correlation
➤ 0.00 to 0.30 (0.00 to −0.30): Negligible correlation
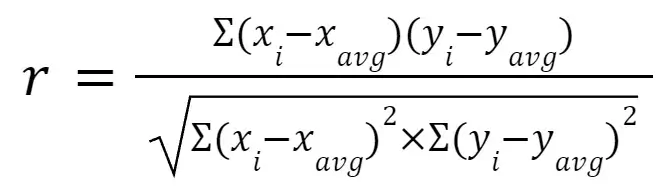
Pearson Correlation Formula
The Pearson correlation coefficient (aka Pearson product moment correlation coefficient) measures the linear relationship between two variables. It also ranges from -1 to 1. The Pearson correlation coefficient is calculated using the formula:
Determine Correlation Coefficient Using CORREL Function
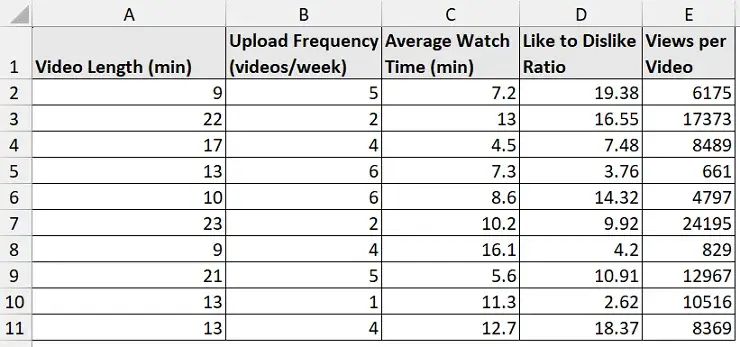
The YouTube channel analytics dataset contains the video length, upload frequency, average watch time, like to dislike ratio, and views per video from columns A through E.
We want to understand how video length and upload frequency affect performance indicators like views or watch time. For example, let’s check if long format videos lead to greater views. Suppose the correlation coefficient is 0.80. This indicates a strong positive correlation, meaning long format videos lead to greater content views.
Steps:
➤ Select the output cell (B13) and use the formula below. The CORREL function returns 0.8599, indicating a strong positive correlation.
=CORREL(A2:A11,B2:B11)
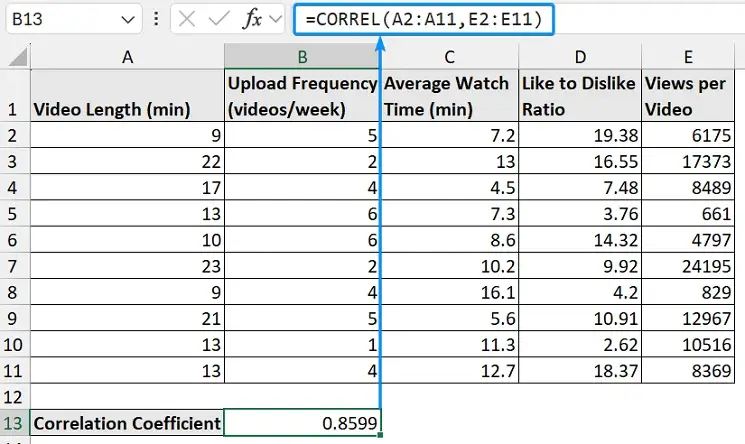
➤ As video length increases, the views per video tend to increase.
➤ It appears viewers find the long format videos more engaging, leading to a greater view count. Therefore, optimizing the video duration could be a strategy to increase viewership.
Find Correlation Coefficient Using PEARSON Function
The Pearson function also calculates the correlation coefficient. It’s mathematically the same, just named after the statistic it calculates!
Steps:
➤ The PEARSON function returns the same correlation coefficient as before.
=PEARSON(B2:B11,C2:C11)
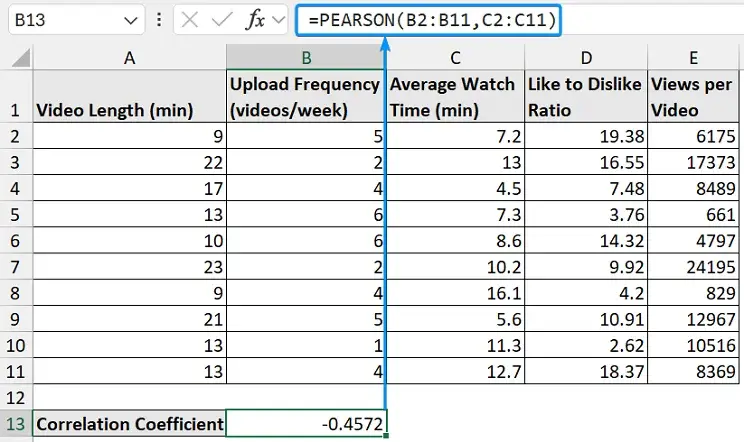
➤ Average watch time tends to decrease as upload frequency increases.
➤ Frequent video uploads tend to lower audience engagement, indicative of increasing the quantity, impacting content quality.
➤ Although there is a negative trend, we cannot jump to a conclusion since the relationship is weak. We should evaluate other metrics to see if this trend holds.
➤ Both CORREL and PEARSON functions ignore texts, blank cells, and logical values but include zeros.
➤ If array1 and array2 arguments have different lengths both functions return #N/A error.
➤ If either array1 or array2 is empty, or if their standard deviation is zero, CORREL returns a #DIV/0! error.
FAQ
How to find the correlation coefficient between two variables in Excel?
=CORREL(array1, array2)
How to calculate the Pearson correlation coefficient in Excel?
=PEARSON(array1, array2)
How do I interpret the value of the correlation coefficient?
➤ 0.90 to 1.00 (−0.90 to −1.00): Very strong positive (negative) correlation
➤ 0.70 to 0.90 (−0.70 to −0.90): Strong positive (negative) correlation
➤ 0.50 to 0.70 (−0.50 to −0.70): Moderate positive (negative) correlation
➤ 0.30 to 0.50 (−0.30 to −0.50): Weak positive (negative) correlation
➤ 0.00 to 0.30 (0.00 to −0.30): Negligible correlation
How to find the coefficient of determination (R square) in Excel?
The RSQ function returns the square of the Pearson product moment correlation coefficient.
=RSQ(known_ys,known_xs)
How to calculate the correlation coefficient for non-numeric data?
Excel’s CORREL and PEARSON functions work with numeric data only. You need to convert non-numeric data like text, categorical values, etc. into numerical form.
Wrapping Up
In this tutorial, we’ve learned about the correlation coefficient and the Pearson correlation coefficient. We’ve also explored how to calculate the correlation coefficient in Excel using the CORREL and PEARSON functions and interpreted the results. Feel free to download the practice file and share your thoughts and suggestions.