The T critical value is the threshold for determining whether a sample data point is statistically significant in the population. It defines the rejection area for the null hypothesis. We can find the T critical value in Excel for one-tailed and two-tailed tests using T.INV and T.INV.2T functions.
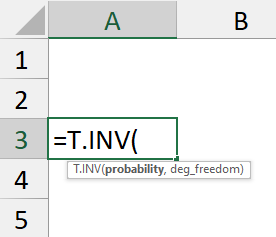
➤ Critical value for left-tailed test: =T.INV(probability,deg_freedom)
➤ Critical value for right-tailed test: =T.INV(1-probability,deg_freedom)
➤ Critical values for two-tailed test: =T.INV.2T(probability,deg_freedom)
➤ The T critical value is the threshold where the null hypothesis is rejected and where it is accepted.
➤ The T distribution is valid when the population standard deviation is unknown and the sample size is less than 30.
In this article, we’ll learn to calculate the T critical values for left-tailed and right-tailed tests using the T.INV function. Next, we’ll explore the two-tailed test using the T.INV.2T function. Lastly, we’ll understand the T distribution and the significance of the T critical values.
What is T Distribution?
The T distribution is a bell-shaped continuous probability distribution. It is flatter and more spread out than the standard normal distribution which helps account for the uncertainty due to the small sample size. The T distribution is used when the population standard deviation is unknown and the sample size is small (less than 30).
Left-Tailed Test
For the left-tailed test, there will be one critical value defining the acceptance and rejection regions. We’ve set the significance level (α) at 0.1 and the degree of freedom to 7.
The formula to get the left-tailed T critical values is given below:
=T.INV(A2,B2)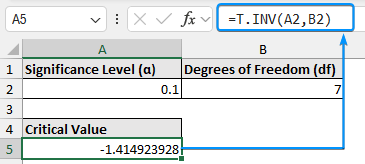
The results of the test will be statistically significant if the T value is less than -1.4149.
Right-Tailed Test
The right-tailed test also has one critical value. Here the significance level (α) is 0.1 and the degree of freedom is 7.
The formula for the right-tailed T critical values is as follows:
=T.INV(1-A2,B2)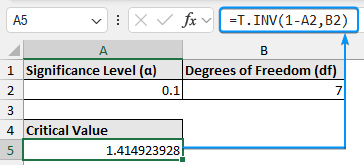
=ABS(T.INV(A2,B2))The test result is significant if the T value is greater than 1.4149.
Two-Tailed Test
The two-tailed test has one acceptance region and two rejection regions. To define these regions we need two critical values. Also, the significance level of the two rejection regions will be divided into two. Thus each rejection region has a probability of α / 2, and the total probability adds up to the significance level.
The formula to calculate the two-tailed T critical values is the following:
=T.INV.2T(A2,B2)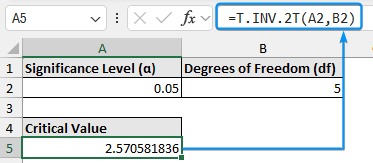
The test result is significant if the T value is less than -2.5706 or if the result is greater than 2.5706.
FAQ
How to calculate the T critical value by hand?
To calculate the T critical value from a T distribution table follow these steps:
➤ Select the significance level (α)
➤ Choose the type of test (one tail or two tail)
➤ Calculate the degree of freedom by subtracting one from the sample size.
➤ Look up the value at the intersection of the degree of freedom and the significance level.
How do you find the t-test value in Excel?
To perform the T-test in Excel, type the function name T.TEST >> enter the data ranges >> specify the type of test (one tail or two tail) >> enter the type >> hit enter.
How to convert the Z score to the T score in Excel?
Multiply the Z score by 10 and add 50 to the result to convert the Z score to the T score. For example, A Z score of 0.3 has a corresponding T score of 53.
When do we use the T distribution?
The T distribution is used when the population standard deviation is unknown and the sample size is less than 30.
Wrapping Up
In this tutorial, we’ve learned how to find T critical value in Excel using the T.INV and T.INV.2T functions. We’ve also discussed the T distribution and the significance of the T critical values. Feel free to download the practice file and let us know which method you like the most.