Excel functions allow you to easily and correctly calculate the mean and standard deviation. Understanding the correct statistical concepts is important whether you are analysing sales performance, reviewing your students’ grades, or simply working with data. ➤ Mean is the centermost value around which all the data points are distributed. In this article, we’ll learn about mean and standard deviation and walk through the step by step process of calculating mean and standard deviation in Excel using the AVERAGE and STDEV.S functions. We’ll also discuss the key findings of our results and understand why these measures are essential for an in depth data analysis.
➤ Standard deviation measures how much the individual data points deviate from the mean.
➤ Mean: =AVERAGE(number1, [number2])
➤ Sample standard deviation: =STDEV.S(number1, [number2])
➤ Population standard deviation: =STDEV.P(number1, [number2])
➤ Mostly, we work with a sample of the population, so we use the STDEV.S or STDEV function.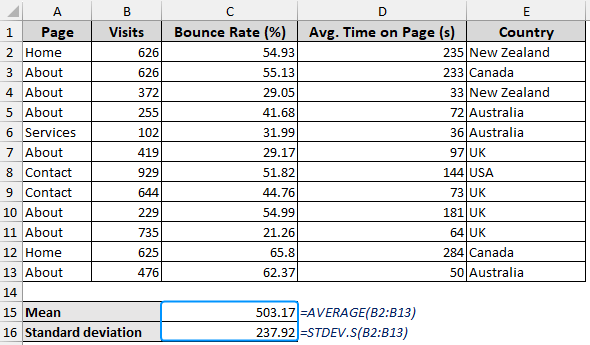
Quick Video Tutorial: Calculate Mean & Standard Deviation in Excel
Understanding Mean and Standard Deviation
Mean: Mean represents a central value of the data points. Mathematically, it is the sum of the data points divided by the number of data points.
Standard Deviation: Standard deviation represents the variation or dispersion in a dataset. It measures how much the individual data points deviate from the mean of the dataset. A low standard deviation indicates the data are close to the mean, while a high standard deviation signifies the data points are spread out.
Calculating Mean and Standard Deviation in Excel
We’ll use the website traffic dataset to calculate the mean visits and the standard deviation. The mean visits represent the average number of people visiting a page. The standard deviation will show the consistency of the visits across various pages.
For example, your website may have an average visitor count of 1000 and a standard deviation of 300. This means some pages receive as many as 1300 visits while others get as few as 700. Using this information, you can improve the content of your website by determining which pages have higher or lower engagement.
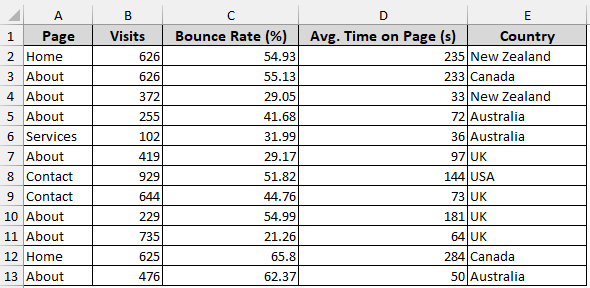
In this dataset, we have the page, visits, bounce rate %, average time on page, and country information in columns A, B, C, D, and E. Let’s calculate the mean, followed by the standard deviation for the number of visits in column B.
Steps:
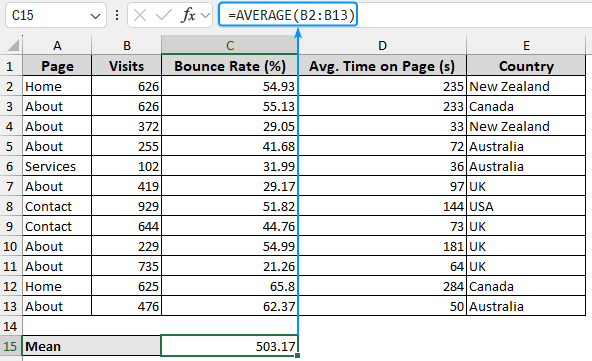
➤ Select the output cell (C15) and type the formula below to calculate the mean.
=AVERAGE(B2:B13)
➤ Use the STDEV.S or STDEV function to calculate the sample standard deviation.
=STDEV.S(B2:B13)
=STDEV.P(B2:B13)
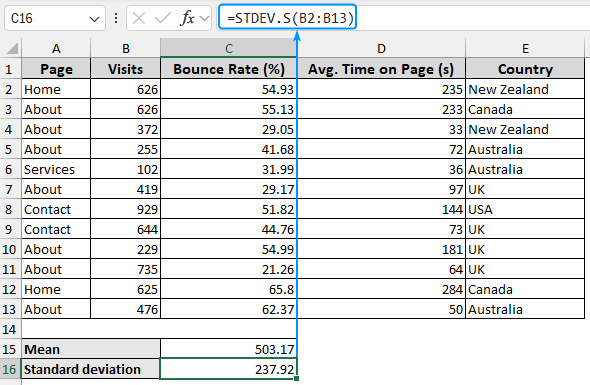
➤ Based on the dataset, we obtained a mean of 503.17 with a standard deviation of 237.92.
➤ The results show moderate variability, indicating a mixture of consistent and inconsistent traffic visits to the different pages.
➤ As a follow up step, we can segment the data by categories for more insights, look for anomalies, or focus on areas that require development, and observe the trends if the variability in page visits reduces over time.
FAQ
How do you find the mean and standard deviation of data in Excel?
Mean: =AVERAGE(number1, [number2])
Standard deviation: =STDEV.S(number1, [number2])
Should I use the STDEV.S or STDEV.P function in Excel?
Use the STDEV.P or STDEVP if your dataset represents the entire population. If the data consists of a sample of the population then use the STDEV.S or STDEV function.
How can I calculate the mean deviation?
Use the AVEDEV function to find the average of the absolute deviations.
=AVEDEV(number1, [number2])
How to calculate the coefficient of variation in Excel?
The coefficient of variation (COV) measures the dispersion of the data relative to the mean.
COV: =standard deviation/mean
How to calculate standard error in Excel?
The standard error (SE) provides an estimate of the variability or precision of a sample statistic relative to the population statistic.
Standard error, SE: =STDEV.S(number1, [number2])/SQRT(sample size)
Wrapping Up
In this tutorial, we’ve learned about the mean and standard deviation, how to calculate mean and standard deviation in Excel using the AVERAGE and STDEV.S functions, and discussed the significance of our results. Feel free to download the practice file and share your thoughts and suggestions.