Standard deviation indicates the variation or dispersion of a set of observations. It signifies the deviation of each observation from the mean. You can use built-in Excel functions to calculate the standard deviation.
➤ Standard deviation is the variation or dispersion in a set of observations.
➤ Population represents the entire dataset while sample is a subset of the population.
➤ Generally, we calculate the sample standard deviation to get an estimate of the population standard deviation.
➤ Sample standard deviation function: =STDEV.S(number1, [number2])
➤ Population standard deviation function: =STDEV.P(number1, [number2])
➤ For text or logical values use: =STDEVA(number1, [number2])
In this article, we’ll learn about the standard deviation, the difference between population and sample standard deviations, and different Excel functions to calculate the standard deviation.
What is Standard Deviation in Statistics?
Standard deviation represents the variation or dispersion in a dataset. It measures how much the individual data points deviate from the mean (average) of the dataset. A low standard deviation indicates the data are close to the mean, while a high standard deviation signifies the data points are spread out.
Population and Sample Standard Deviation
Population refers to all the observations in the dataset while sample represents a subset of data taken from the population. In most cases, we calculate the sample’s standard deviation to guess the population’s standard deviation.
Overview: STDEV.S Function in Excel
The STDEV.S or the STDEV function estimates the standard deviation based on a sample. This function ignores logical or text values in the sample.
Syntax
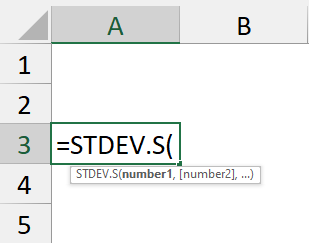
The syntax for the STDEV.S function is given below.
=STDEV.S(number1, [number2])➤ number1: represents a sample of a population.
➤ number2: (Optional)
The syntaxes for the other standard deviation functions (STDEV.P, STDEVA, STDEVPA) are similar.
Different Standard Deviation Functions
| Function | Population | Sample | Logical values and text |
|---|---|---|---|
| STDEV.S or STDEV | ✓ | ❌ | |
| STDEV.P or STDEVP | ✓ | ❌ | |
| STDEVA | ✓ | ✓ | |
| STDEVPA | ✓ | ✓ |
Calculating Standard Deviation of Numeric Values
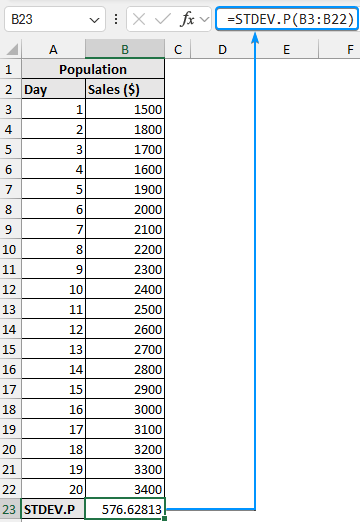
In this dataset, we have the daily sales figures for a small retail business over 20 days. We’ll consider this as the entire population and calculate the standard deviation.
➤ Select the output cell (B23) and enter the formula for the population standard deviation.
=STDEV.P(B3:B22)
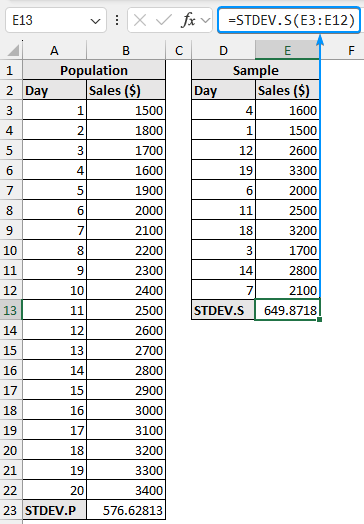
➤ The table below shows a sample of 10 randomly selected observations from the population. Let’s calculate the sample standard deviation using the STDEV.S or STDEV function.
=STDEV.S(E3:E12)
Calculating Standard Deviation of Logical Values and Text
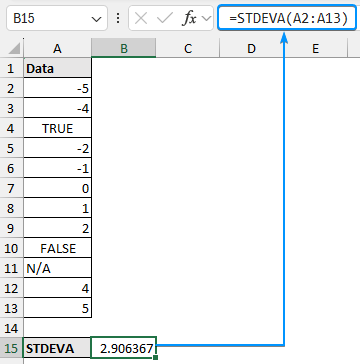
If our dataset contains logical values (TRUE/FALSE) or text, we need to use the STDEVA or the STDEVPA function for the sample or population standard deviation respectively. Any text or logical value FALSE is considered zero (0) while the logical value TRUE is considered one (1).
➤ Select the cell B15 and use the STDEVA function.
=STDEVA(A2:A13)
➤ STDEV.S calculates the sample standard deviation, while STDEV.P calculates the population standard deviation.
➤ STDEV.S calculates the standard deviation using the ‘n-1’ method whereas STDEV.P calculates the standard deviation using the ‘n’ method.
➤ Both STDEV.S and STDEV.P work with numerical values, any blank cells, logical values, and text are ignored.
➤ To calculate logical values and text representation of numeric data, use the STDEVA or the STDEVPA function.
➤ The STDEVA or STDEVPA function converts the logical value TRUE to 1 and text or FALSE to 0.
FAQ
What is the difference between STDEV.S and STDEV.P?
The STDEV.S function calculates the sample standard deviation. In contrast, the STDEV.P function calculates the population standard deviation.
Can I calculate the standard deviation for logical values and text in Excel?
Standard deviation is usually calculated for numeric data. For logical values (TRUE/FALSE) you can use the STDEVA function which considers TRUE as 1 and FALSE as 0. You need to convert texts to a suitable numeric scale.
How do I handle missing or empty cells in my data range?
The standard deviation functions automatically ignore empty cells, missing data won’t affect the calculation.
Should I use the STDEV.S or STDEV.P function in Excel?
Use the STDEV.P or STDEVP if your dataset represents the entire population. If your data is a sample of the population then use the STDEV.S or STDEV function.
How can I calculate the average or mean deviation?
Use the AVEDEV function to find the average of the absolute deviations.
=AVEDEV(number1, [number2])
How to calculate the coefficient of variation in Excel?
The coefficient of variation (COV) measures the dispersion of the data relative to the mean.
COV: = standard deviation/mean.
How to calculate standard error in Excel?
The standard error (SE) provides an estimate of the variability or precision of a sample statistic relative to the population statistic.
SE: =STDEV.S / SQRT(sample size).
Wrapping Up
In this tutorial, we’ve learned about the standard deviation, various standard deviation functions in Excel, and how to calculate the standard deviation. Feel free to download the practice file and share your thoughts and suggestions.