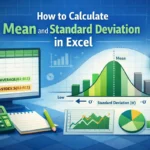
Excel makes it easy to calculate uncertainty, which helps you determine your data’s consistency. Understanding uncertainty is important for improving performance and establishing reasonable expectations, whether you are monitoring delivery times, manufacturing quality, or customer service response times.
➤ Uncertainty measures the range within which the true value is expected to lie. In this article, we’ll learn about uncertainty and walk through the step by step process of calculating uncertainty in Excel using the AVERAGE, STDEV.S, and CONFIDENCE.NORM functions. We’ll also discuss the key findings and understand the importance of uncertainty in making decisions.
➤ Mean: =AVERAGE(cell_reference)
➤ Standard deviation: =STDEV.S(cell_reference)
➤ Uncertainty: =CONFIDENCE.NORM(alpha,standard_dev,size)
➤ Confidence intervals: mean ± uncertainty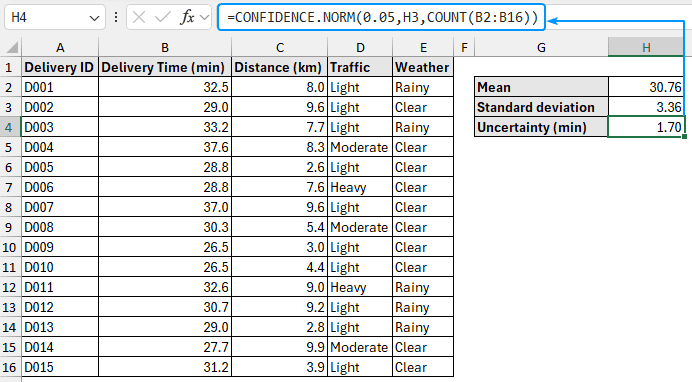
What is Uncertainty in Statistics?
Uncertainty measures the range within which the real value is expected to lie. A low uncertainty indicates results are close to the mean value, whereas a high uncertainty indicates results are more spread out. Understanding uncertainty helps you assess the dependability and predictability of your processes and results.
Calculating Uncertainty in Excel
The mean delivery time and associated uncertainty will be calculated using the delivery time tracking dataset. The mean delivery time displays the average time taken to finish a delivery, while the uncertainty indicates the degree of variation in delivery times across several trips.
For example, if the average delivery time is 25 minutes with an uncertainty of 5 minutes, it means most deliveries take between 20 and 30 minutes. However, some deliveries may be quicker or slower due to other variables like bad weather or high traffic.
By analyzing uncertainty, you can enhance delivery operations, optimize scheduling, and provide a better customer experience.
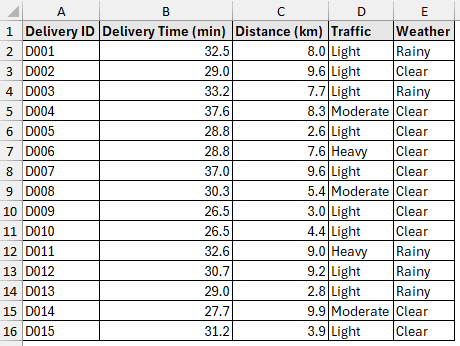
In this dataset, we have the delivery ID, delivery time, distance, traffic, and weather information in columns A, B, C, D, and E. Let’s calculate the mean and the associated uncertainty for the delivery times in column B.
Steps:
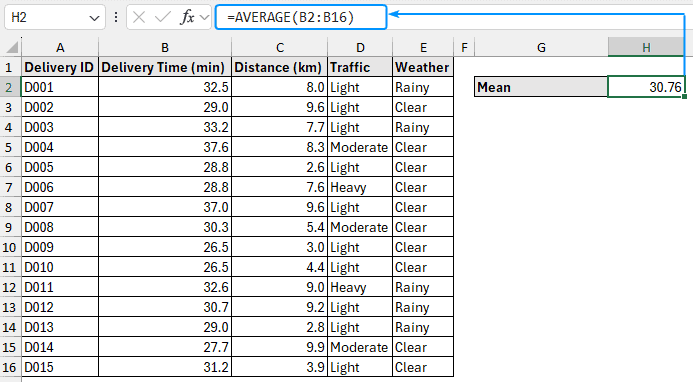
➤ Select the output cell (H2) and use the AVERAGE function to calculate the mean.
=AVERAGE(B2:B16)
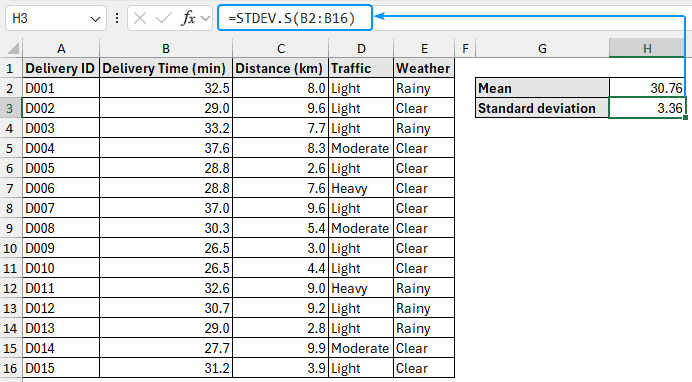
➤ Calculate the sample standard deviation using the STDEV.S or STDEV function.
=STDEV.S(B2:B16)
=STDEV.P(B2:B16)
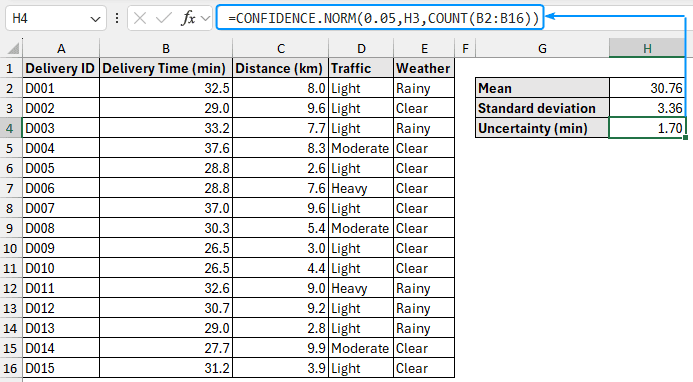
➤ Use the CONFIDENCE.NORM function to find the uncertainty in the delivery times.
=CONFIDENCE.NORM(0.05,H3,COUNT(B2:B16))
➤ Finally, construct a confidence interval, mean ± uncertainty. The confidence interval for our example is 30.76 ± 1.70.
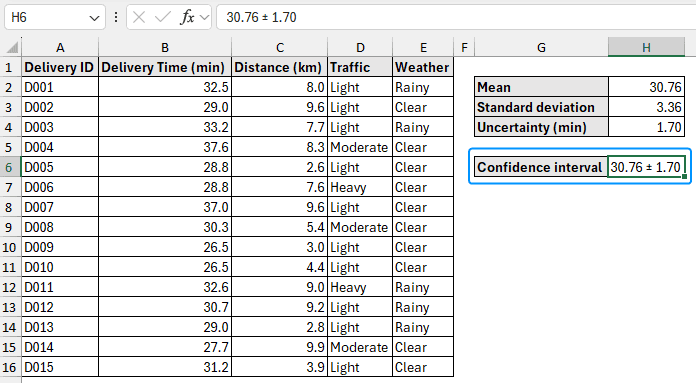
➤ With an uncertainty of 1.7 minutes, the average delivery time is 30.76 minutes.
➤ Despite other factors like traffic and weather, deliveries are largely consistent. This is further supported by the comparatively low uncertainty.
➤ We can segment the data by weather or traffic conditions to observe the impact of other variables like traffic, weather, etc.
➤We may add a date column to see if operational improvements are reducing the uncertainty over time.
FAQ
How do you find uncertainty in Excel?
Uncertainty: =STDEV.S(cell_reference)/SQRT(COUNT(cell_reference))
How to calculate absolute, relative, and percentage uncertainties?
➤ Absolute uncertainty: =(Max value - Min value)/2
➤ Relative uncertainty: =Absolute uncertainty/Measured value
➤ Percentage uncertainty: =(Absolute uncertainty/Measured value)*100%
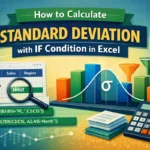
How to calculate standard error in Excel?
The standard error (SE) provides an estimate of the variability or precision of a sample statistic relative to the population statistic.
SE: =STDEV.S(cell_reference) / SQRT(COUNT(cell_reference))
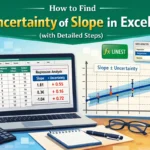
How to find the uncertainty of slope in Excel?
Use the LINEST function: =LINEST(known_ys, [known_xs], [const], [stats])
➤ known_ys: dependent variable
➤ [known_xs]: (Optional) independent variable
➤ [const]: (Optional) logical value. If TRUE constant is calculated normally; if FALSE constant is set to zero
➤ [stats]: (Optional) logical value. TRUE returns additional regression statistics; FALSE returns only coefficient
How to show uncertainty in an Excel graph?
Select the Chart >> Click on Chart Elements (plus icon) >> Check Error Bars >> Choose an option (standard error, percentage, standard deviation).
Wrapping Up
In this tutorial, we’ve learned about uncertainty and how to calculate uncertainty in Excel using the AVERAGE, STDEV.S, and CONFIDENCE.NORM functions. Moreover, we discussed the significance of our results. Feel free to download the practice file and share your thoughts and suggestions.