A test for normal distribution compares various statistics of the data to determine if the data follows a normal distribution. You can perform several test for normal distribution in Excel.
➤ The normality test checks if the sample data follows a normal distribution.
➤ Quick and dirty normality check: If the mean and median are relatively close and skewness is close to zero.
➤ Jarque-Bera Test: Calculate the J-B test statistic then use it to calculate the Chi-square distribution P value. Data is normally distributed if the P value is greater than the significance level.
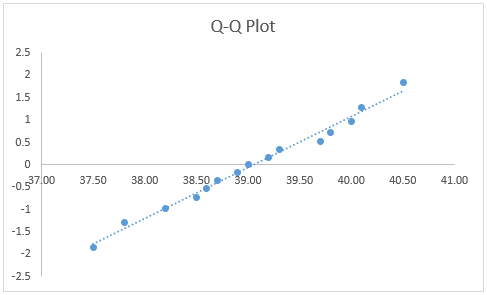
➤ Q-Q plot: If the data points lie approximately in a straight line at a 45-degree angle, then it follows a normal distribution.
In this article, we’ll learn two ways to perform test for normal distribution in Excel using the Jarque-Bera test and the Q-Q plot.
What is Test for Normal Distribution?
Test for normal distribution determines if a dataset is well-modeled by a normal distribution. It compares the skewness, kurtosis, and other characteristics of the data with that of a normal distribution.
Quick Check for Normality
A quick and dirty method of checking normality in Excel involves:
➤ Check if the mean is relatively close to the median value.
➤ Also, check if the skewness is close to zero.
If the mean is relatively close to the median and the skewness is close to zero then there is a chance that the data is normally distributed.
Jarque-Bera Test for Normal Distribution
The Jarque-Bera test uses the skewness and kurtosis of the data to check if they compare to that of a normal distribution. For a normal distribution, the Jarque-Bera statistic follows a Chi-square distribution with 2 degrees of freedom. The formula for the Jarque-Bera test is given below:
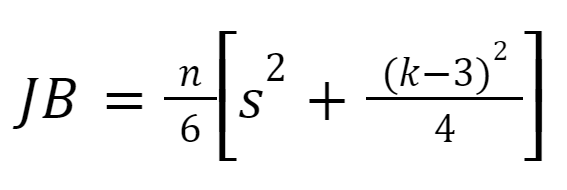
where
➤ n is the number of observations
➤ s is the skewness of the dataset
➤ k is the kurtosis of the dataset
The test hypotheses are as follows:
Null hypothesis: The data follows a normal distribution.
Alternate hypothesis: The data does not follow a normal distribution.
If the p-value of the Chi-square distribution is greater than the significance level (5%), we fail to reject the null hypothesis. The data can be assumed to be normally distributed.
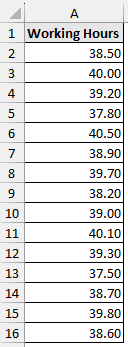
The following dataset shows the number of hours worked in a week. Let’s use the Jarque-Bera test to check if this dataset is normally distributed.
Steps:
➤ In the output cell (D2), use the COUNT function to find the number of data points.
=COUNT(A2:A16)
➤ Use the SKEW function to calculate the skewness of the distribution.
=SKEW(A2:A16)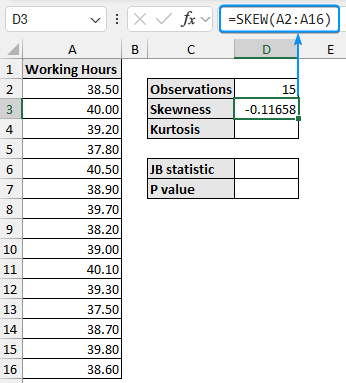
➤ Move to the cell D4 and use the KURT function to get the excess kurtosis.
=KURT(A2:A16)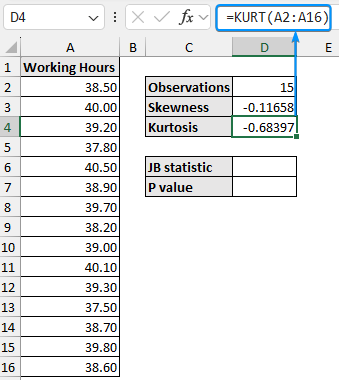
➤ Using the formula, we get a Jarque-Bera statistic value of 0.326362.
=(D2/6)*((D3^2)+(D4^2)/4)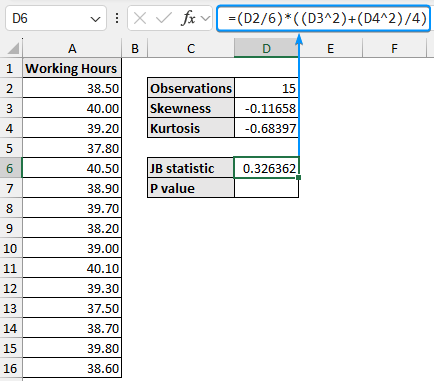
➤ The P value for the Jarque-Bera statistic is 0.849438.
=CHISQ.DIST.RT(D6,2)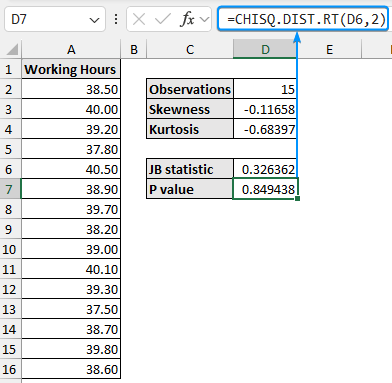
Q-Q Plot for Normality
The Q-Q (quantile-quantile) compares the distribution of a dataset to a theoretical distribution (normal distribution) to check for normality. Follow the steps to generate a Q-Q plot.
Steps:
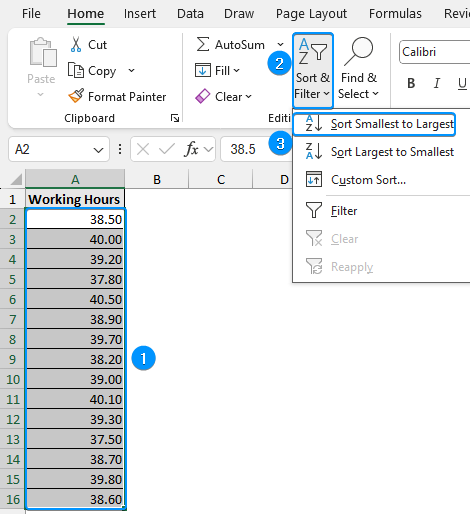
➤ Select the dataset (A2:A16) >> Sort & Filter >> Sort Smallest to Largest.
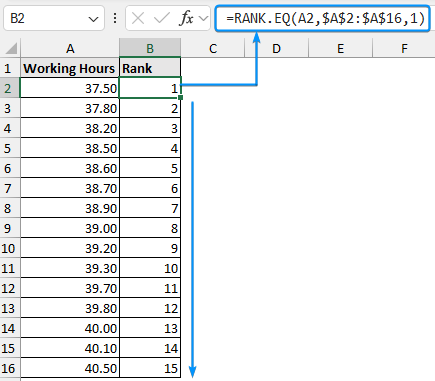
➤ Use the RANK.EQ function to rank all the values and copy the formula to the cells below.
=RANK.EQ(A2,$A$2:$A$16,1)
=RANK(A2,$A$2:$A$16,1).
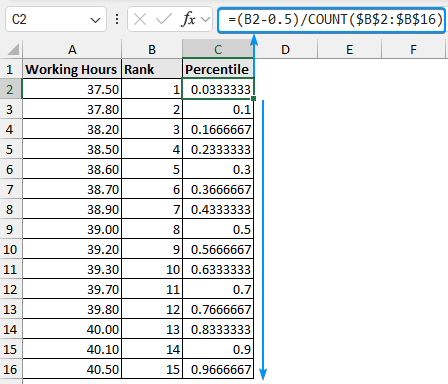
➤ Calculate the percentile and drag the Fill Handle tool.
=(B2-0.5)/COUNT($B$2:$B$16)
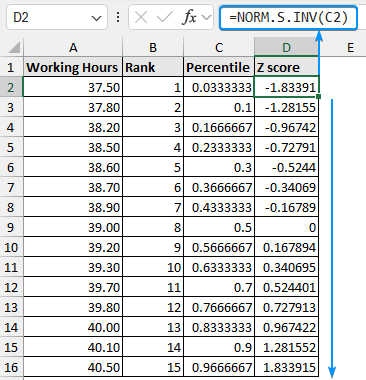
➤ Obtain the Z scores with the NORM.S.INV function. For earlier versions of Excel, use the NORMSINV function.
=NORM.S.INV(C2)
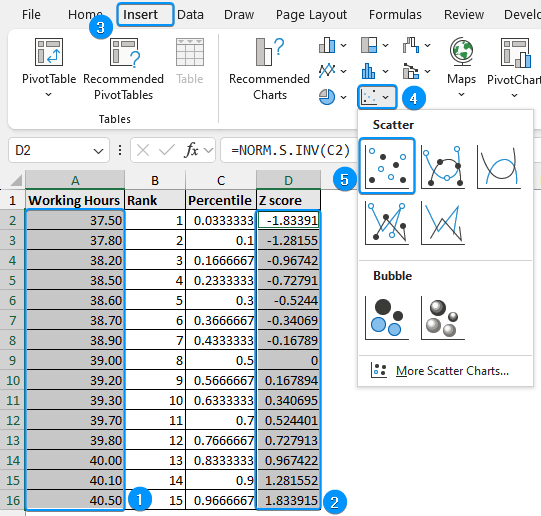
➤ Select the working hours (A2:A16) and Z scores (D2:D16) >> Insert >> Scatter (X,Y) or Bubble Chart >> Scatter.
➤ Set a suitable chart title >> Click Chart Elements (+ icon) >> Uncheck Gridlines >> Enable Trendline.

FAQ
How to check if data is normally distributed in Excel?
Plot a histogram with the data points and inspect its shape. The shape is unlikely to be smooth but if the peak is in the middle and the plot is fairly symmetrical, then the data can be assumed to be normally distributed.
How do I create a histogram in Excel to check for normal distribution?
Select the data >> Go to Insert tab >> Choose Histogram >> Right-click on any bin >> Format Data Series >> Adjust bin settings if needed.
Why perform a test for normal distribution?
Many statistical methods and models assume that the data follows a normal distribution. So verifying normality ensures the validity of these methods and their predictions.
What are some common tests of normality?
There are several tests for normality. Here are a few examples:
➤ Graphical Methods:
- Q-Q Plot
- Histogram
➤ Statistical Tests:
- Jarque-Bera Test
- Shapiro-Wilk Test
What should I do if my data is not normally distributed?
If the data is not normally distributed, consider:
➤ Checking for any potential outliers. Remove them and run the test again.
➤ Applying a data transformation (like logarithmic, square root) to normalize the data.
➤ Using non-parametric statistical methods that do not assume a normal distribution.
Wrapping Up
In this tutorial, we’ve learned to test for normal distribution in Excel using the Jarque-Bera test and Q-Q plot. Feel free to download the practice file and let us know which method you like the most.