Is multicollinearity misleading your regression results? The Variance Inflation Factor (VIF) helps you determine the degree of multicollinearity between independent variables and interpret the correct regression results. Although Excel doesn’t have a built in function for calculating the variance inflation factor, there’s an easy workaround. This tutorial will teach you how to calculate variance inflation factor in Excel and how to interpret the results using step by step example. By the end, you will be able to identify and address multicollinearity problems in your linear regression analysis.
➤ VIF measures the presence and degree of multicollinearity between independent variables in a regression analysis. In this article, we’ll learn about the variance inflation factor and how to calculate variance inflation factor in Excel using Data Analysis ToolPak. We’ll also interpret the results and learn to correct high multicollinearity.
➤ Formula for VIF: =1/(1-R2)
➤ VIF of 1 means no correlation.
➤ VIF between 1 and 5 represents a moderate correlation.
➤ VIF more than 5 indicates a high correlation.
➤ Enable Data Analysis: File >> Options >> Excel Add-ins >> Data Analysis.
➤ Get R2 value: Data tab >> Data Analysis >> Regression >> Input Y Range >> Input X Range >> Labels >> New Worksheet >> OK.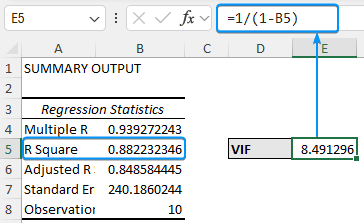
What is Variance Inflation Factor (VIF)?
Variance inflation factor (VIF) measures the presence and degree of multicollinearity in a regression analysis. Multicollinearity exists if two or more independent variables are correlated in a multi-regression model. Therefore VIF represents the degree of inflation of a regression coefficient due to multicollinearity.
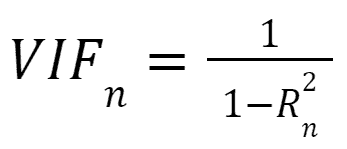
where,
R2 is the unadjusted coefficient of determination.
➤ A VIF value of 1: no correlation
➤ A VIF value between 1 and 5: moderate correlation
➤ A VIF of more than 5: high correlation
Calculating Variance Inflation Factor
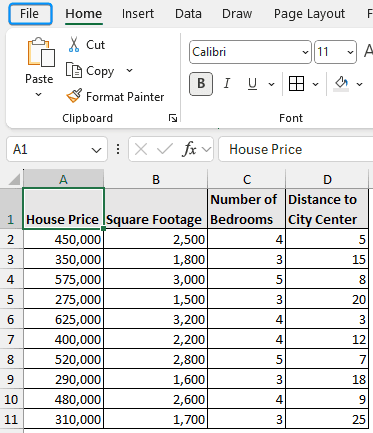
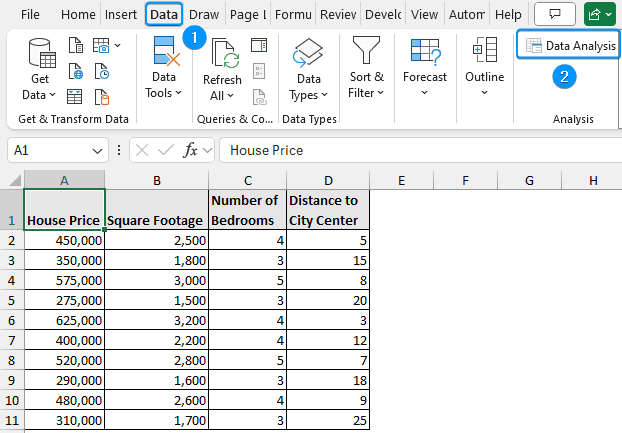
The house price dataset contains the house price, square footage, number of bedrooms, and distance from city center from columns A through D.
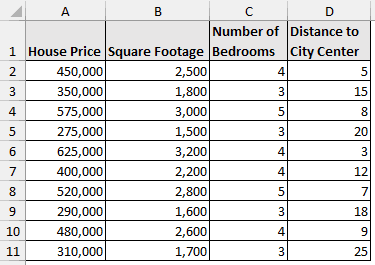
The house price is the dependent variable, while the independent variables are square footage, number of bedrooms, and the distance to city center.
Assume you work as a real estate analyst. To forecast house prices, you created a regression model. But you suspect there may be a relationship between square footage, number of bedrooms, and distance to city center. To verify your suspicion, you want to calculate the VIF for every independent variable.
Using Excel’s Data Analysis add-in, let’s determine the VIF for each independent variable. Each independent variable is regressed against every other independent variable to check for multicollinearity. The variance inflation factor is calculated using the R2 value. Before starting, follow these steps to enable the Data Analysis add-in.
Steps:
➤ Click on the File tab.
➤ Select Options. You can also use the shortcut Alt + F + T to open Excel Options.

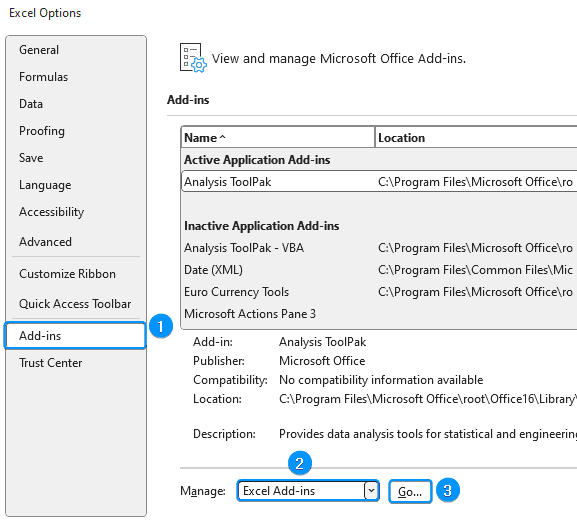
➤ Select Add-ins >> Choose Excel Add-ins from the dropdown >> Go.
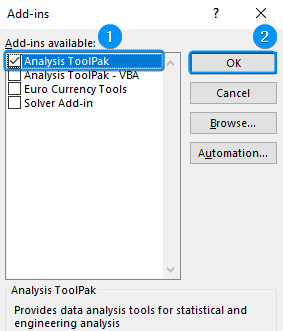
➤ Check the Analysis ToolPak option >> OK.
The Data Analysis option will be available in the Data tab whenever you open a new workbook.
➤ Go to the Data tab >> Click Data Analysis.
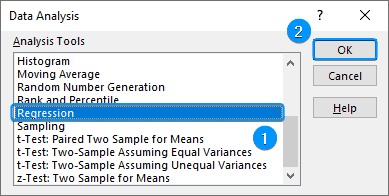
➤ Select Regression >> OK.
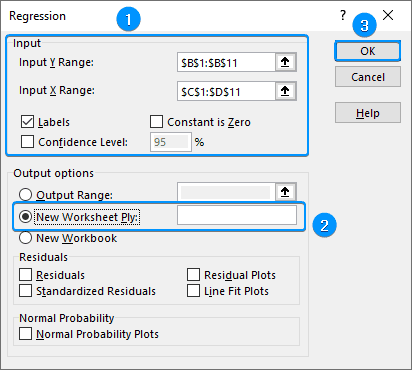
➤ Select ‘Square Footage’ (B1:B11) for Input Y Range >> Select ‘Number of Bedrooms’ and ‘Distance to City Center’ (C1:D11) as Input X Range >> Check Labels >> New Worksheet Ply >> OK.
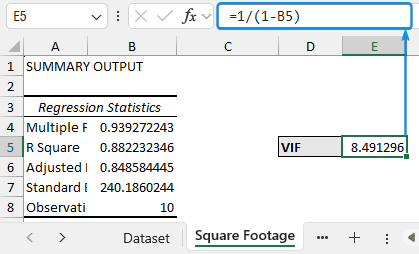
➤ In the ‘Square Footage’ worksheet, calculate the VIF.
=1/(1-B5)
➤ Make a copy of the ‘Square Footage’ worksheet >> Set worksheet name to ‘No. of Bedrooms’ >> Copy the ‘Square Footage’ column (B1:B11) >> Paste in column E (E1:E11).
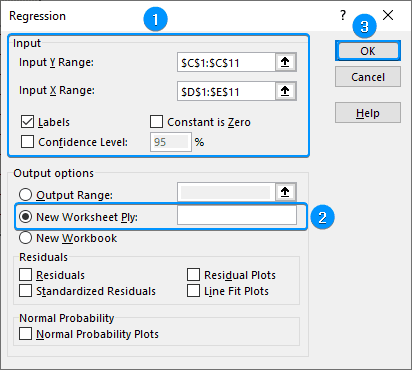
➤ Data Analysis >> Regression >> Choose ‘Number of Bedrooms’ (C1:C11) as Input Y Range >> Select ‘Square Footage’ and ‘Distance to City Center’ (D1:E11) for Input X Range >> Labels >> New Worksheet Ply >> OK.
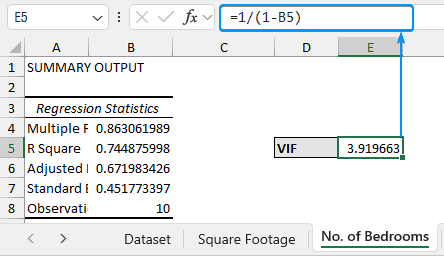
➤ Calculate the VIF for ‘Number of Bedrooms’.
=1/(1-B5)
➤ Create another copy of the ‘Square Footage’ worksheet >> Rename to ‘Distance to city center’.
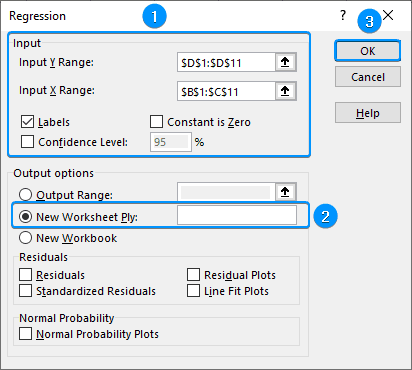
➤ Data Analysis >> Regression >> Select ‘Distance to City Center’ (D1:D11) as Input Y Range >> Select ‘Square Footage’ and ‘Number of Bedrooms’ (B1:C11) as Input X Range >> Labels >> New Worksheet Ply >> OK.
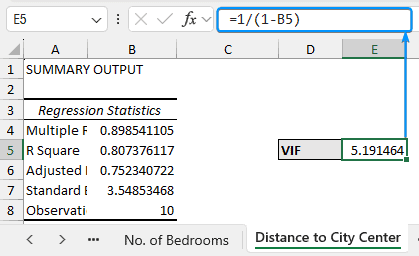
➤ Calculate the VIF for ‘Distance to City Center’.
=1/(1-B5)
Summary Table
| Variable | R2 | VIF |
|---|---|---|
| Square footage | 0.882 | 8.49 |
| Number of bedrooms | 0.744 | 3.92 |
| Distance to city center | 0.807 | 5.19 |
Correcting High Variance Inflation Factor (Multicollinearity)
To correct high multicollinearity:
➤ Removing one of the highly correlated variables reduces multicollinearity.
➤ Combine variables to improve the accuracy of the model.
➤ Use principal component analysis to reduce the number of variables or make new uncorrelated variables.
FAQ
Why is VIF calculated?
To check for the presence and degree of multicollinearity between independent variables. A high VIF makes regression results unreliable.
What is the formula for the variance inflation factor?
VIF: =1/(1-R2)
What is a good VIF score?
Generally, A VIF equal to or less than 3 is acceptable. As VIF value increases the regression results become less reliable.
Why is multicollinearity a problem in regression analysis?
Multicollinearity makes it difficult to evaluate the individual effect of each independent variable on the dependent variable, which can lead to unreliable results.
How can I reduce high VIF values?
➤ Remove one of the highly correlated variables.
➤ Use principal component analysis to reduce the number of variables or make new uncorrelated variables.
What’s the difference between VIF and tolerance?
Tolerance measures how much of the variance in a predictor is not explained by other predictors. It is the reciprocal of VIF. Tolerance=1−R2
In contrast, VIF indicates the presence and degree of multicollinearity between independent variables.
How to tell if my model is affected by multicollinearity?
Multicollinearity may be responsible for high VIFs and unexpected signs or statistical insignificance of the regression coefficients.
Wrapping Up
In this tutorial, we’ve learned about the variance inflation factor and how to calculate the variance inflation factor in Excel using Data Analysis ToolPak. Feel free to download the practice file and share your thoughts and suggestions.