To understand the condition of a business, it is important to calculate the year-over-year growth. A business owner might want to know the current year-over-year growth rate or predict the future year-over-year growth using the current rate. In this article, we will learn year over year growth formula excel so that we can calculate it with ease.
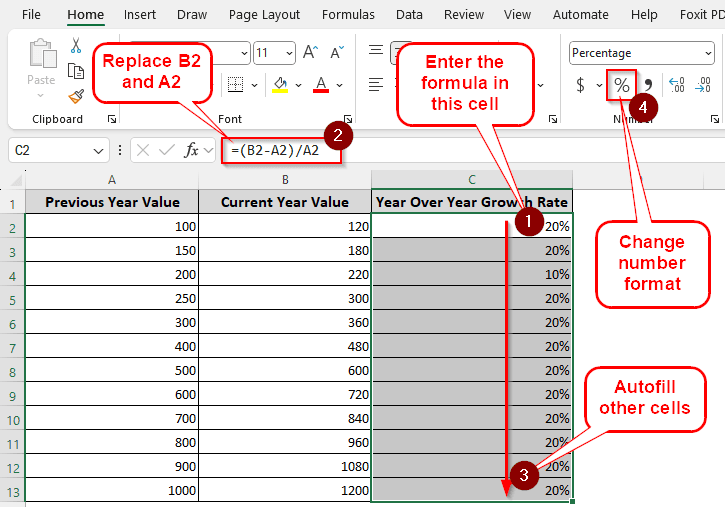
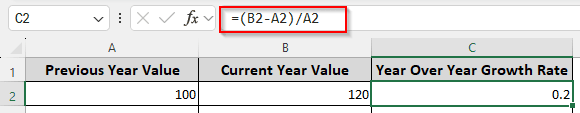
➤ Write this formula in the desired column: =(B2-A2)/A2
➤ Replace A2 with the previous year’s value and B2 with the current year’s value.
➤ Press Enter to get the result, and autofill other cells if you need to.
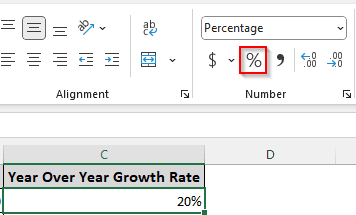
➤ Change the number format to Percentage.
That was one method, but there are more formulas to do the job as well. Moreover, if you have a growth rate, you might want to calculate the growth amount of the next year using the year-over-year rate. In this tutorial, we have all the techniques you can use to achieve your goal. Therefore, read the whole article and download the workbook to follow along.
What is Year Over Year Growth?
The year-over-year growth is the rate of growth of a company/stock/asset compared to the previous year. For example, if a company has a valuation of 100 dollars in 2024, and the valuation becomes 110 in 2025, the growth rate is 10%. By measuring the year-over-year growth, a company can understand its financial performance and make strategies that will help it increase its growth rate.
Calculating Year-Over-Year Growth Rate from Two Years’ Data
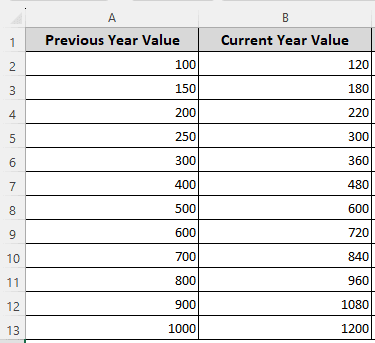
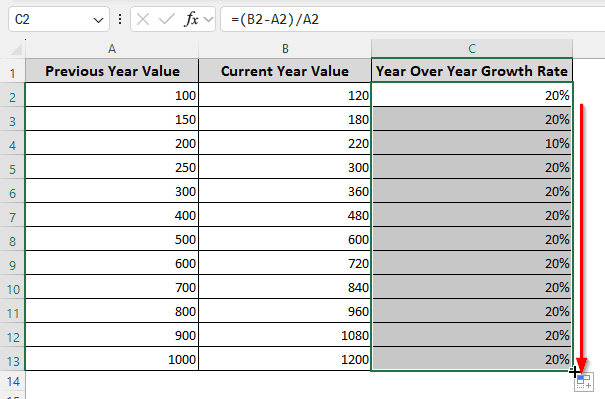
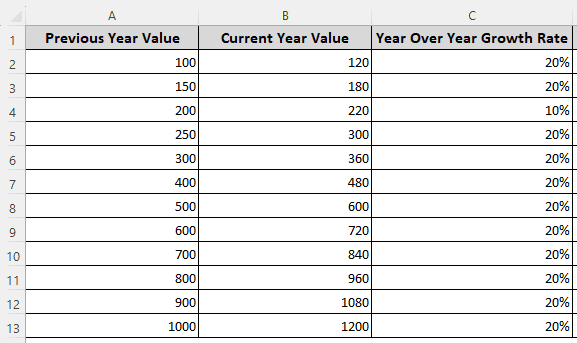
In this example, we have a dataset that has the previous year and current year values in two columns. In the third column, we will extract the year-over-year growth rate. Follow the steps below:
➤ Insert this formula in the first row (other than the heading) of the column.
=(B2-A2)/A2
➤ In the Home tab, locate the Number group, and select the percentage icon (%) to convert that 0.2 into 20%.
➤ Autofill other cells using your mouse to complete the table.
Determining Year-Over-Year Growth Rate from Multiple Years Data
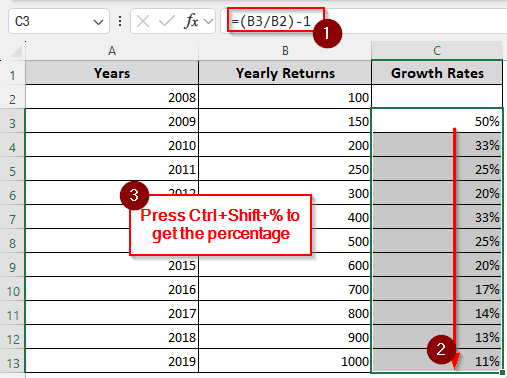
This time, we will be working with the values of a bunch of years. We will use another formula and get the result from the data of a few consecutive years.

➤ Leave the first row of the column blank. We don’t have the data for the previous year, so we cannot determine the rate for the first year.
➤ Write the formula in the next row:
=(B3/B2)-1
➤ Autofill the other cells.
➤ Keep the cells selected, and press Ctrl+Shift+% to convert the decimal numbers to percentages.
Presuming Year-Over-Year Growth Using Specific Rate
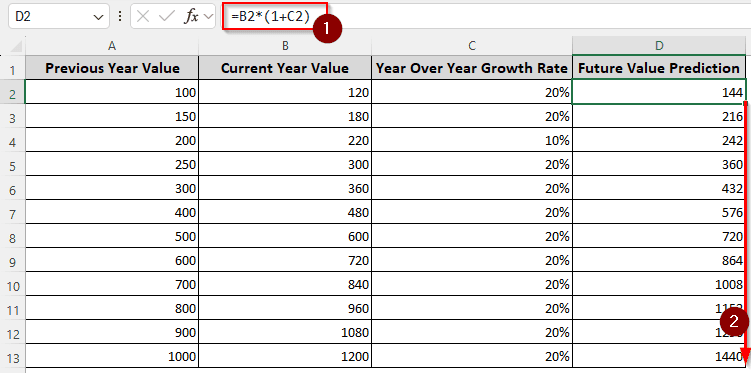
So far, we have shown the formulas you can use to find the year-over-year growth rate. But what if you already have a rate but don’t know what value the upcoming year might bring? This time, we will determine just that. We will utilize the table we obtained from the first method.
➤ We will add a column for future value prediction, and use this formula:
=B2*(1+C2)
➤ Autofill other cells like you did before.
Frequently Asked Questions
What is the year over year growth chart?
The year-over-year growth chart gives a visual representation of the growth rates of a stock or a company. Whether the company’s performance is increasing or not can be known by looking at the chart.
How to calculate percentage growth?
Similar to the year-over-year calculation, first, you need to minus the old value from the new value. Then divide the result by the old value and multiply the final result by 100 to get the percentage.
What is a good yoy growth rate?
It depends on the company, as a very new company will have a lower rate, then suddenly have an extremely high rate, then settle at a medium growth rate. However, if we look at statistics, most companies fluctuate between a 15% to 45% growth rate.
How to use year formula in Excel?
The YEAR function returns the year from a string of dates. Consider this formula, for example:
=YEAR(“13-June-2025”)
Upon entering this formula in a cell, the function will return 2025 as the result.
Is 20% yoy good?
The yoy rate strictly depends on the industry a company belongs to, and the company’s business. However, the growth rate of 20% is generally good.
Wrapping Up
In this article, we learned the year-over-year growth formula in Excel. We hope that you have been able to understand the process on how to apply the formulas for your own project. Download the workbook, and you can see the formulas in action by yourself. Until next time, let us know what you think about the tutorial by replying below.