The F-test is a type of hypothesis test that compares the variances of different groups to determine if they differ significantly. You can use built-in add-ins and functions to do F-test in Excel.
➤ F-test compares two variances to check for any significant differences.
➤ To quickly calculate the P value use the =F.TEST(array1, array2) function.
➤ For earlier versions of Excel use the =FTEST(array1, array2) function.
➤ The Data Analysis add-in returns the results for the one-tailed F-test.
➤ The F.TEST or FTEST function returns the P value of the two-tailed F-test.
In this article, we’ll explore the F-test and how to perform one-tailed and two-tailed F-tests in Excel. We’ll use the Data Analysis ToolPak and the F.TEST function and learn to interpret the F-test results.
What is F Test in Statistics?
The F-test determines if the variances of two normally distributed populations are equal. Variance is a measure of the variation or spread within a dataset. Like other hypothesis tests, the F-test uses sample data to make inferences about the entire population.
The two-sample two-tailed F-test has the following hypotheses:
Null hypothesis: The population variance of both groups is the same.
Alternate hypothesis: The population variance of the two groups is not the same.
If the P value is less than the significance level (like 0.05), we can reject the null hypothesis. The difference in population variance of the two groups is significant. However, if the P value is greater than the significance level, we cannot reject the null hypothesis i.e. there is no significant difference in the population variance.
Two Sample F-Test with Data Analysis ToolPak
In this dataset, we have the daily high temperatures of two cities: city A in Column A and city B in Column B. We want to know if there is any significant difference in the variance in temperature.
Null hypothesis: There is no difference in the variance of temperatures between the two cities.
Alternate hypothesis: City B has a higher variance of temperature compared to city A.
Steps:
➤ Calculate the temperature variance for city A >> Select the output cell (B14) and enter the formula.
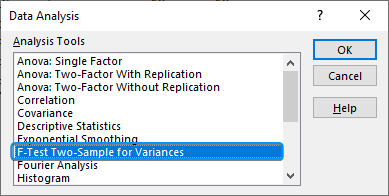
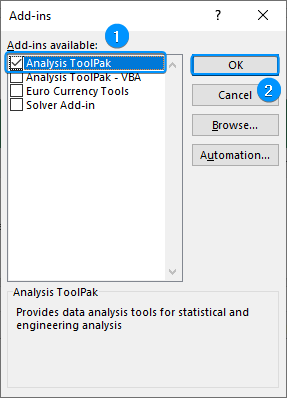
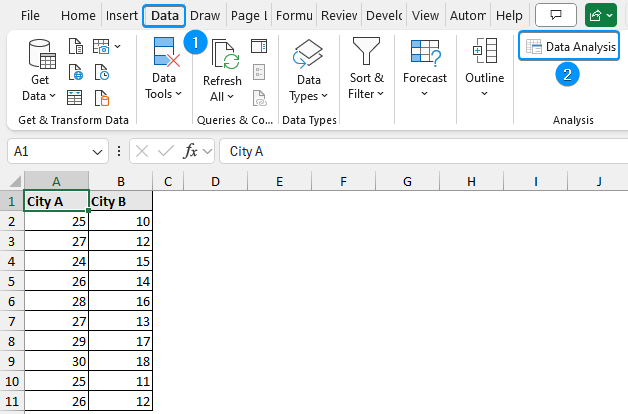
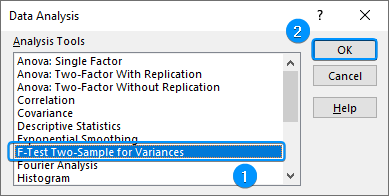
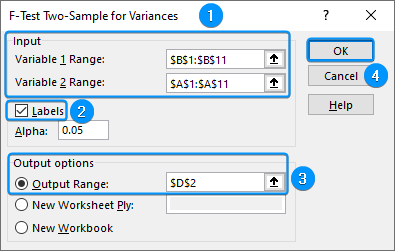
➤ Calculate the temperature variance for city B using the formula: ➤ Enable the Data Analysis ToolPak. Click on the File tab. ➤ Choose Options. You can also use the shortcut Alt+F+T to open Excel Options. ➤ Select Add-ins >> Choose Excel Add-ins from the dropdown >> Go. ➤ Check the Analysis ToolPak option >> OK. The Data Analysis ToolPak will be available in the Data tab whenever you open a new workbook. ➤ Go to the Data tab >> Select Data Analysis. ➤ Choose F-Test Two-Sample for Variances >> OK. ➤ For the Variable 1 Range, select the sample with the higher variance (city B) >> choose city A for the Variable 2 Range. ➤ If the first row contains headers, you must check the Labels option. The default significance level is 5%. Select the output range (D2). ➤ You’ll get the results shown below. ➤ The variance for city B is 7.066667 and the variance for city A is 3.566667. You can use the F.TEST or FTEST function to calculate the two-tailed P-value. The dataset below compares reaction times to a stimulus for two groups: younger adults and older adults. We want to determine if there is any significant difference in the variance in reaction times between the two groups. Null hypothesis: There is no difference in the variance of reaction times between the two groups. Steps: ➤ Select the output cell (B13) >> enter the formula: ➤ The P value is 0.013340923 which is less than the significance level (0.05). To calculate the F critical value use the F.INV for the left tail or the F.INV.RT for the right tail. The syntax for this function is =F.INV(probability, deg_freedom1,deg_freedom2). Enter the significance level as the probability argument and the degrees of freedom for the numerator and denominator. F-Test: compares the variances of two populations to determine if they are equal. ➤ Select the F table that corresponds to your significance level. In this tutorial, we learned about the F-test and how to perform the F-test in Excel using the F.TEST function and Data Analysis ToolPak. We also discussed the test results. Feel free to download the practice file and let us know which method you like the most.=VAR.S(A2:A11)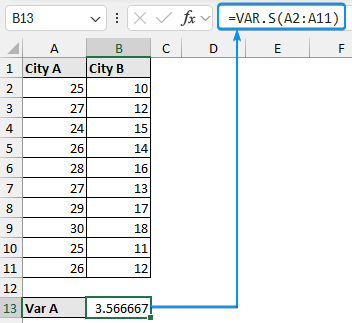
=VAR.S(B2:B11)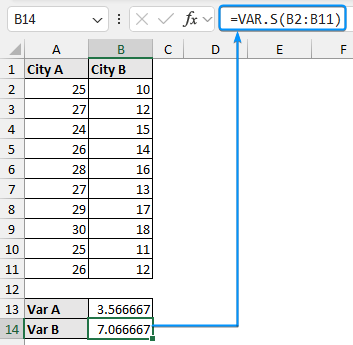


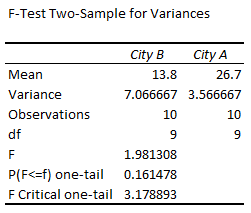
➤ The P value for the test is 0.161478 is greater than the significance level (0.05).
➤ We cannot reject the null hypothesis. So there is no significant difference in the temperature variance of the two cities.Two Sample F-Test using F.TEST Function
Alternate hypothesis: Older adults have a higher variance of reaction time compared to younger adults.=F.TEST(A2:A11,B2:B11)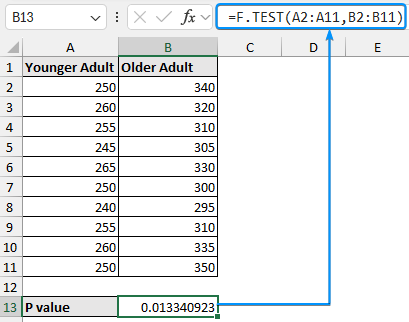
➤ We can reject the null hypothesis and conclude that the two variances differ significantly.FAQ
How to find F critical value in Excel?
What is the difference between F-Test and T-Test in Excel?
T-Test: compares the mean values of two populations to determine if they significantly differ from each other.How to find the F table value?
➤ Locate the intersection of the numerator’s and denominator’s degrees of freedom.
➤ This is the critical F value. If the calculated F statistic is greater than the F critical value then the result is significant.Wrapping Up