The F.DIST function in Excel returns the left-tailed F probability distribution for two datasets. It signifies the degree of diversity between the datasets.
➤ F.DIST function returns the left-tailed probability density function or cumulative distribution function for the F distribution.
➤ It measures the degree of diversity between two sets of data.
➤ For the left-tailed probability: =F.DIST(x,deg_freedom1,deg_freedom2,cumulative)
➤ For the right-tailed probability: =F.DIST.RT(x,deg_freedom1,deg_freedom2)
In this article, we’ll learn briefly about the F.DIST and F.DIST.RT functions, their syntaxes, and usage in Excel.
Overview: F.DIST Function in Excel
The F.DIST function returns the left-tailed probability density function or cumulative distribution function for the F distribution. It measures the variability between two datasets.
Syntax
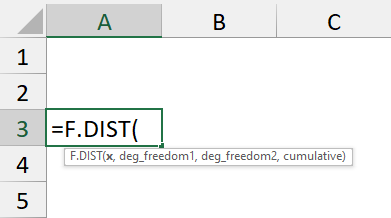
The syntax for the F.DIST function is given below. It takes 4 mandatory arguments.
=F.DIST(x,deg_freedom1,deg_freedom2,cumulative)➤ x argument: Value at which to evaluate the function.
➤ deg_freedom1: Numerator’s degrees of freedom.
➤ deg_freedom2: Denominator degrees of freedom.
➤ cumulative: Logical value, where TRUE returns cumulative distribution function and FALSE returns probability density function.
Example of Using the F.DIST Function in Excel
In this dataset, we have 10 batches of an item in Column A. The production times needed using Process A and Process B in Columns B and C.
Steps:
➤ Enter a value at which to evaluate the function like 42.
➤ Select the output cell (C14) and calculate the numerator degree of freedom:
=COUNT(B2:B11)-1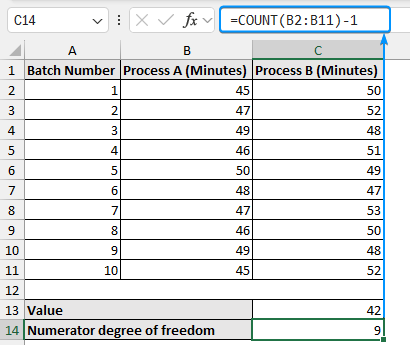
➤ Obtain the denominator degree of freedom:
=COUNT(C2:C11)-1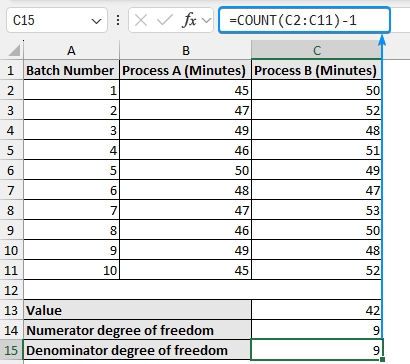
➤ Use the F.DIST function to get the F probability. Here TRUE returns the cumulative distribution function.
=F.DIST(C13,C14,C15,TRUE)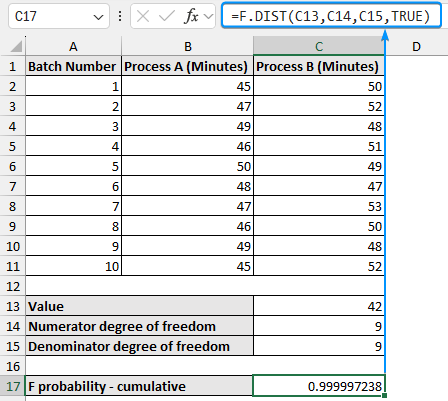
➤ Using the FALSE argument returns the probability density function.
=F.DIST(C13,C14,C15,FALSE)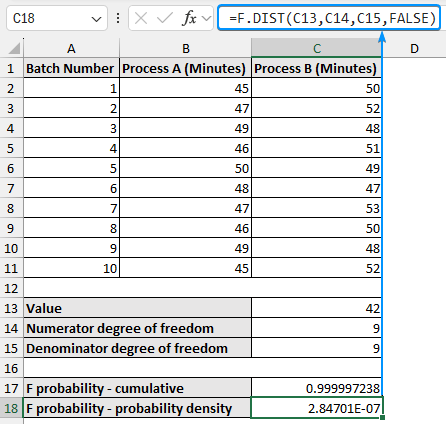
The F.DIST function returns a value between 0 and 1, indicating the chance of occurrence of a value less than or equal to the entered value (x).
Applications of the F.DIST Function
➤ Hypothesis testing: comparing the F.DIST result with the significance level. We can reject the null hypothesis if the cumulative probability is less than or equal to the significance level.
➤ Confidence interval: the cumulative probability from the F.DIST function to define a confidence interval for the population parameter range.
➤ ANOVA and Regression analysis: the F.DIST result can be used to evaluate the F statistic’s significance.
F.DIST.RT Function in Excel
The F.DIST.RT function returns the right-tailed F probability density distribution.
Syntax
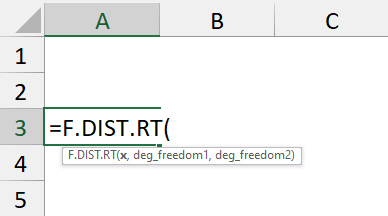
The syntax for the F.DIST.RT function is shown below with the 3 required arguments.
=F.DIST.RT(x,deg_freedom1,deg_freedom2)➤ x argument: Value at which to evaluate the function.
➤ deg_freedom1: Numerator’s degrees of freedom.
➤ deg_freedom2: Denominator degrees of freedom.
Example of Using the F.DIST.RT Function in Excel
Considering the same dataset let’s calculate the right-tailed F probability.
Steps:
➤ Choose the output cell (B17) and enter the formula:
=F.DIST.RT(C13,C14,C15)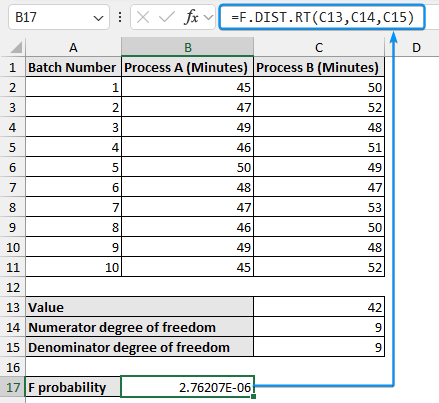
The F.DIST.RT function returns a value between 0 and 1. It gives the probability of occurrence of a value greater than or equal to the entered value (x).
Notes on F.DIST and F.DIST.RT Functions
➤ Entering a non-numeric argument returns #VALUE! error.
➤ F.DIST and F.DIST.RT returns #NUM! error if x is less than zero (negative).
➤ The degree of freedom values gets truncated in the case of decimal values.
➤ If the degree of freedom values are negative the function returns #NUM! error.
FAQ
What is F.DIST in Excel?
The F.DIST returns the left-tailed F probability distribution which is a measure of the degree of diversity between two datasets.
How to find F critical value in Excel?
Use the F.INV or the F.INV.RT function to get the left or right-tailed critical F value. Use the significance level as the probability argument.
What are the applications of the F distribution?
The F distribution is used in:
➤ Hypothesis testing
➤ Analysis of variance (ANOVA)
➤ Regression analysis
Wrapping Up
In this quick tutorial, we’ve learned about the F.DIST and F.DIST.RT functions in Excel. We’ve discussed the syntax, application, and usage notes. Feel free to download the practice file and share your thoughts below.