The Friedman test uses ranks to compare more than two groups. It is used when normality and equal variance conditions are not satisfied. Although there are no built-in functions to perform the Friedman test in Excel, there is a simple workaround.
➤ Friedman Test is a non-parametric test for comparing ranks across more than two groups when normality and equal variances are not satisfied. In this article, we’ll learn about the Friedman test and how we can perform and interpret the results of this test.
➤ The ranks of the observations are used instead of the values of the observations.
➤ The highest value is assigned a rank of 1, followed by the consecutive values.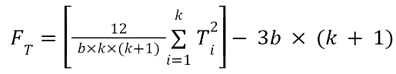
What is Friedman Test in Statistics?
The Friedman test is a non-parametric statistical test that compares more than two groups with a blocking variable. It is suitable for observations where normality and equal variances are not met. In this test, the observations are ranked within each block (the highest value gets rank 1 and so on) and the sum of ranks between groups is compared.
This test is useful for testing the same subjects under different conditions. The Chi-square distribution is used to calculate the P value so all Friedman tests are one-tailed tests. The formula for Friedman statistic:
where
b is the number of rows or blocks
k is the number of columns or treatments
Ti2 is the squared sum of the ranks of sample treatments
Example of Friedman Test in Excel
In this dataset, we compare the effectiveness of three different diets on weight loss. The same group of participants follows each diet for a month, and their weight loss (in pounds) is recorded at the end of each period. The two hypotheses are stated below:
Null hypothesis: The weight loss is the same for all the diets (treatments).
Alternate hypothesis: The weight loss is not the same for all diets.
Steps:
➤ Select the output cell (G2) and enter the formula to rank the values in each row in ascending order.
=RANK.AVG(B2,$B2:$D2,1)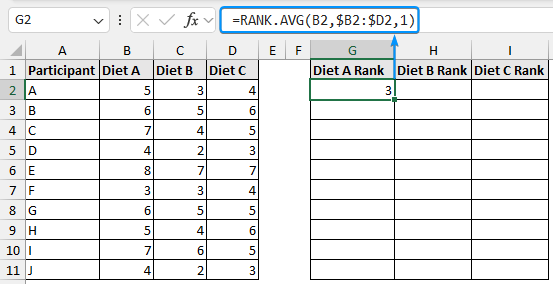
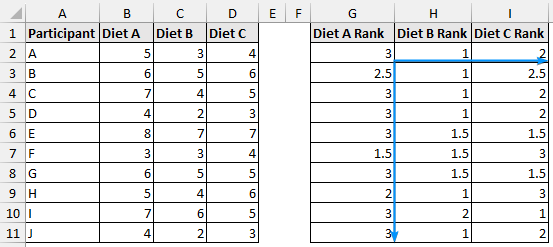
➤ Drag the Fill Handle across and then down to rank all the data points.
➤ Use the SUM function and apply the Fill Handle tool.
=SUM(G2:G11)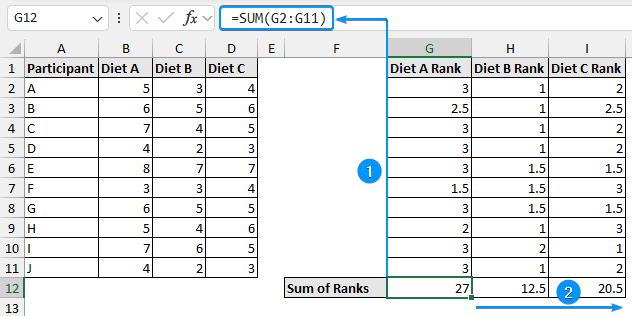
➤ Calculate the squared sum of ranks for the three diets.
=G12^2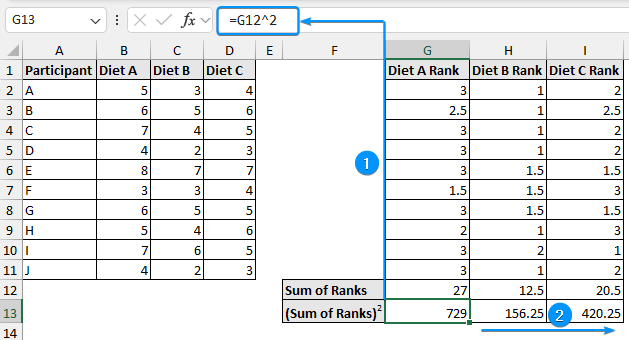
➤ Determine the number of participants (blocks) with the COUNTA function.
=COUNTA(A2:A11)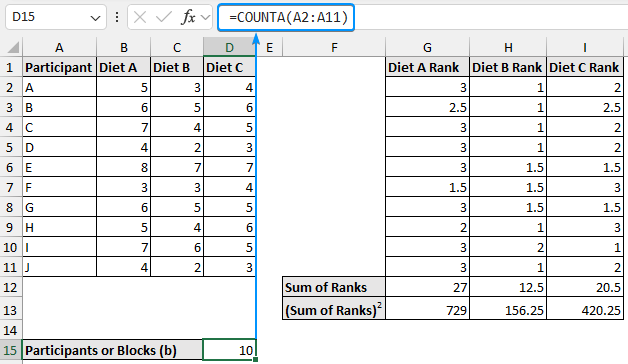
➤ Similarly, obtain the number of diets (treatments).
=COUNTA(B1:D1)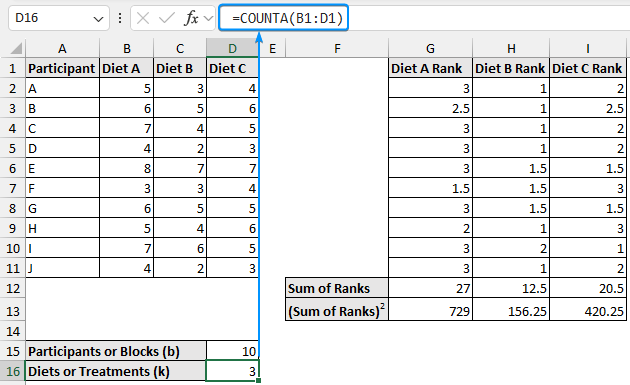
➤ The formula to calculate the Friedman statistic is given below. It is convenient to break the formula into smaller parts. The first part of the formula evaluates to 0.1000.
=12/(D15*D16*(D16+1))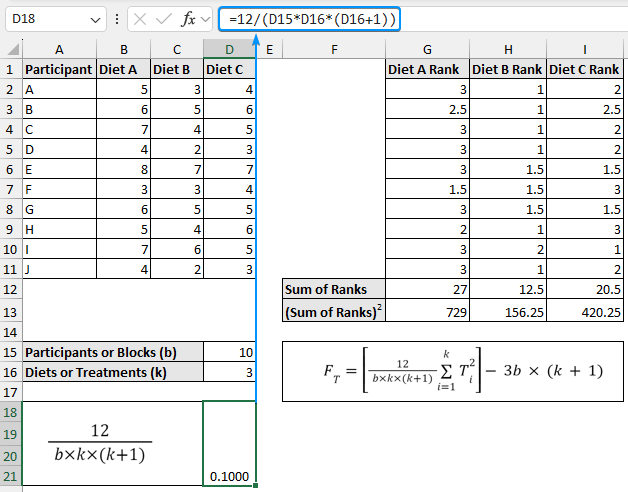
➤ In the second part add up all the sum of rank squared values to get a value of 1305.5.
=SUM(G13:I13)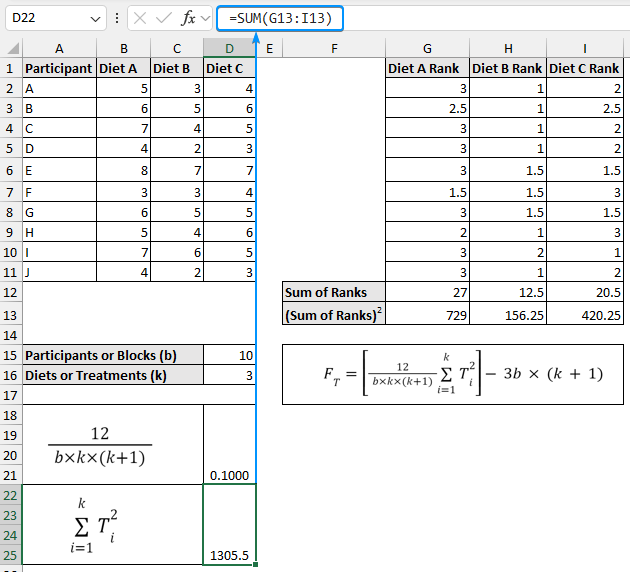
➤ The third part returns a value of 120.
=(3*D15)*(D16+1)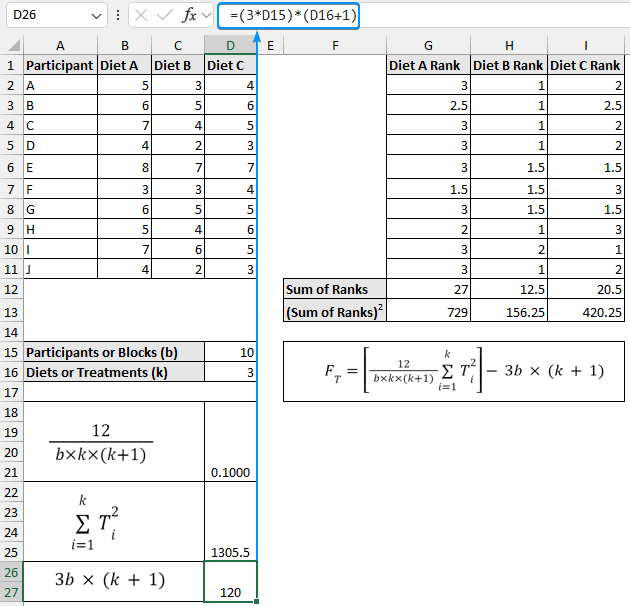
➤ Select a suitable significance level (0.05).
➤ Calculate the Friedman statistic:
➤ Now, determine the Chi-square critical value. Choose the significance level (0.05) as the probability. ➤ Also, calculate the P value. The Friedman test is used when normality and equal variance conditions are unmet. For normally distributed data we use parametric tests like the Two way block ANOVA test. In contrast, we use the Friedman test if the data is not normally distributed. The Friedman test is the non-parametric version of the ANOVA test. Ranks are used because, by focusing on the sum of ranks instead of the mean difference, the Friedman test can handle data that does not need to follow a normal distribution. All Friedman tests are one-tailed tests since the Chi-square distribution is used to calculate the P value. In this tutorial, we’ve learned about the Friedman test, how to perform the Friedman test in Excel and interpret the test results. Feel free to download the practice file and share your thoughts in the comments below.=(D18*D22)-D26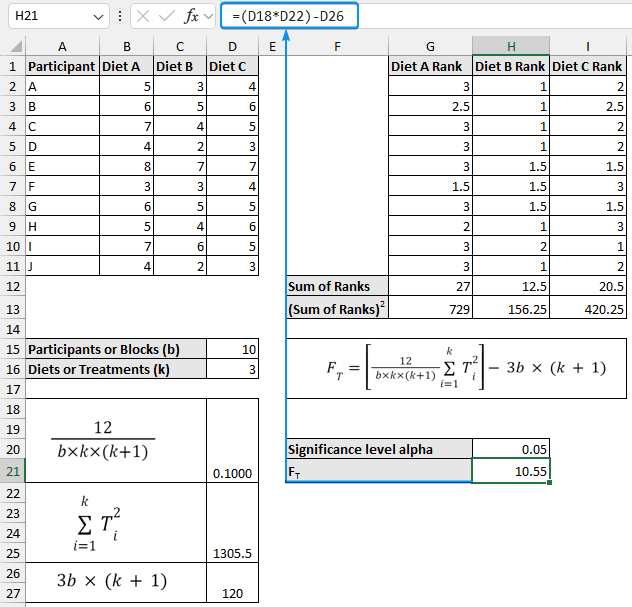
=CHISQ.INV.RT(H20,D16-1)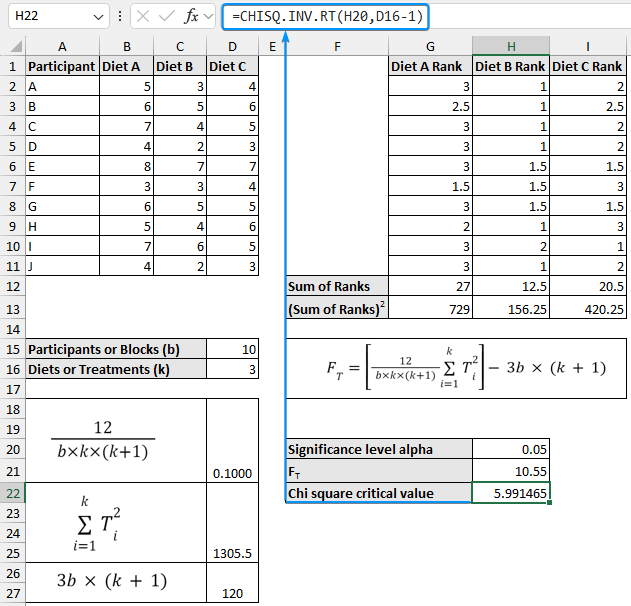
=CHISQ.DIST.RT(H21,D16-1)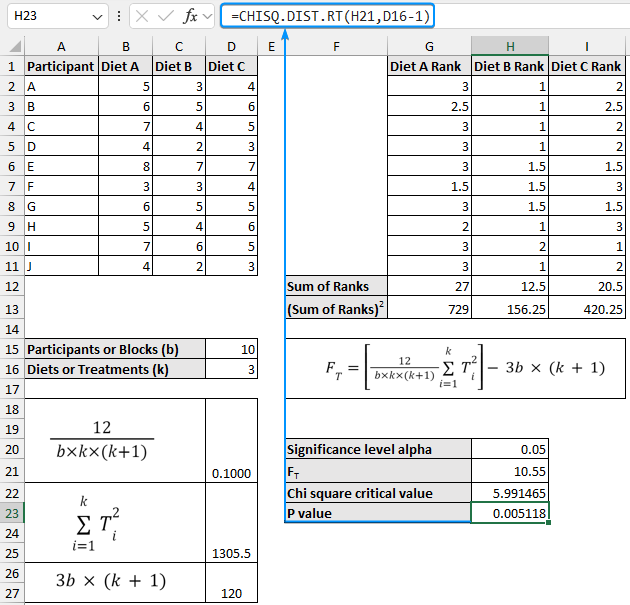
FAQ
When to use the Friedman test?
What is the difference between ANOVA and Friedman test?
Why are ranks used in the Friedman test?
Why one-tailed test is used for the Friedman test?
Wrapping Up