A lognormal distribution represents the distribution of a random variable whose logarithm is normally distributed. You can create a log normal distribution in Excel using built-in functions.
➤ A random variable whose logarithm is normally distributed gives a lognormal distribution.
➤ The lognormal distribution is positively skewed with a long right tail.
➤ Lognormal distribution function: =LOGNORM.DIST(x,mean,standard_dev,cumulative)
➤ Earlier version: =LOGNORMDIST(x,mean,standard_dev)
In this article, we’ll learn about the log normal distribution in Excel with two examples. We’ll use the LOGNORM.DIST function, if you’re using an earlier version of Excel you can use the LOGNORMDIST function instead.
What is Log-Normal Distribution?
If the logarithm of a variable is normally distributed this results in a lognormal distribution. This distribution is used to model stock prices, environmental studies, engineering, etc. The characteristics of lognormal distribution are as follows:
➤ The mean and standard deviation of the lognormal distribution are related to the underlying normal distribution.
➤ The lognormal distribution is positively skewed with a long right tail.
LOGNORM.DIST Function in Excel
The LOGNORM.DIST or LOGNORMDIST function returns the lognormal distribution of a value x.
Syntax
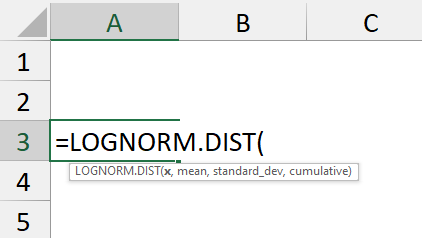
The syntax for the LOGNORM.DIST function is given below. It takes 4 mandatory arguments.
=LOGNORM.DIST(x,mean,standard_dev,cumulative)
➤ x argument: Value at which to evaluate the function.
➤ mean: Mean of ln(x).
➤ standard_dev: Standard deviation of ln(x).
➤ cumulative: Logical value, where TRUE returns cumulative distribution function and FALSE returns probability density function.
Finding Lognormal Distribution of Any Value X
In this dataset, we have the closing stock prices in Column A. Let’s use the LOGNORM.DIST function to find the lognormal distribution at any given value X.
Steps:
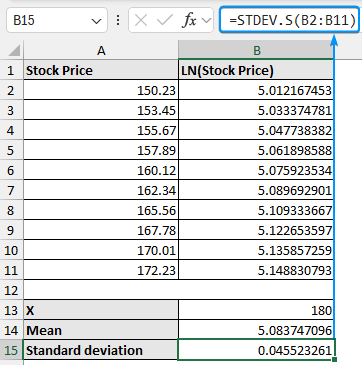
➤ Select the output cell (B2) and use the LN function to get the natural logarithmic values of the stock prices. Copy the formula to the cells below.
=LN(A2)
➤ Choose a value for X (180) and find the mean of natural logarithmic values of the stock prices.
=AVERAGE(B2:B11)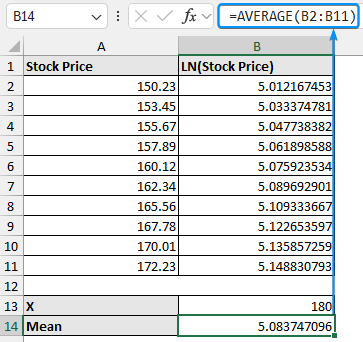
➤ Calculate the sample standard deviation using the STDEV.S function or the STDEV function.
=STDEV.S(B2:B11)
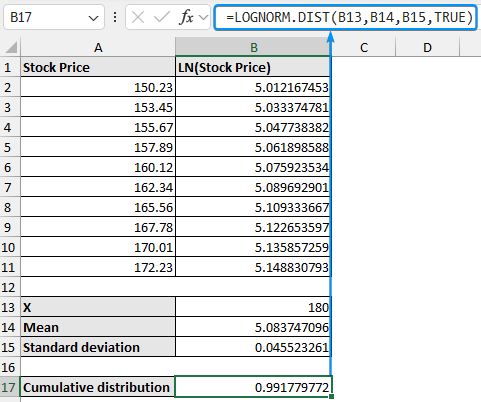
➤ Calculate the cumulative distribution function at the closing stock price X (180).
=LOGNORM.DIST(B13,B14,B15,TRUE)
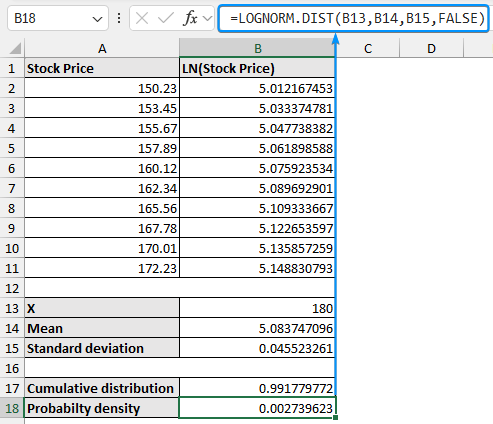
➤ Obtain the probability density function at X.
=LOGNORM.DIST(B13,B14,B15,FALSE)
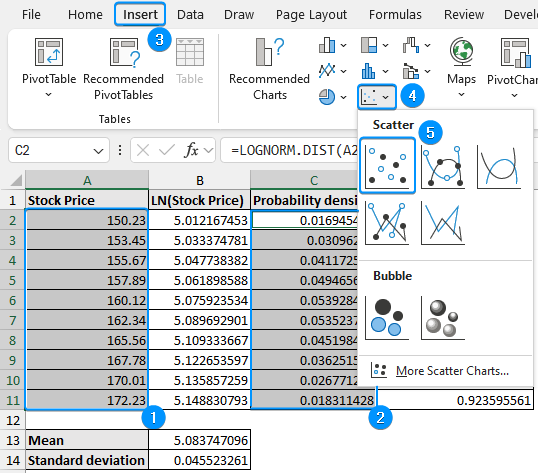
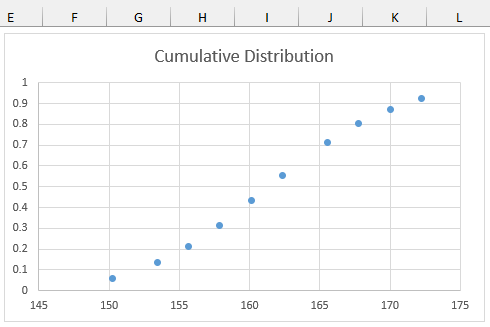
Let’s create plots for the cumulative distribution and probability density using the LOGNORM.DIST function and Excel Charts. Steps: ➤ Find the mean and standard deviation as before. Use this formula to get the probability density values for all the stock prices. ➤ Calculate the cumulative distribution. ➤ Select the stock prices (A2:A11) and probability density (C2:C11) >> Insert >> Scatter (X,Y) or Bubble Chart >> Scatter. ➤ Set a suitable chart title. ➤ Similarly, plot the cumulative distribution and give a chart title. Notes: A normal distribution is a symmetric, bell-shaped distribution where most of the data points lie close to the mean. On the other hand, a lognormal distribution is the probability distribution of a variable whose logarithm is normally distributed. Lognormal distribution has a positive skew with a long right tail. Returns the inverse of the lognormal cumulative distribution function of x. Here are some real-world applications of the lognormal distribution.: No, the lognormal distribution is applicable for positive values since the logarithm of a negative number is undefined. A lognormal distribution is positively skewed with a long right tail. This indicates a few large values compared to most of the data points. In this tutorial, we’ve learned about the log normal distribution in Excel through two examples. Feel free to download the practice file and share your thoughts and suggestions.Plotting a Lognormal Distribution in Excel
=LOGNORM.DIST(A2,$B$13,$B$14,FALSE)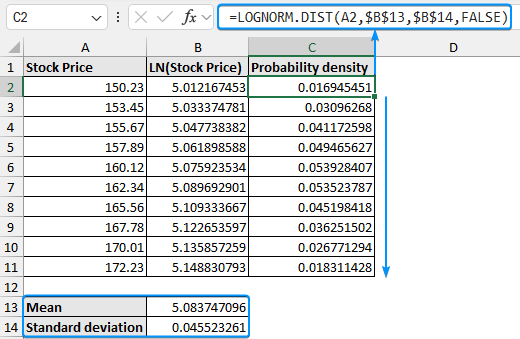
=LOGNORM.DIST(A2,$B$13,$B$14,TRUE)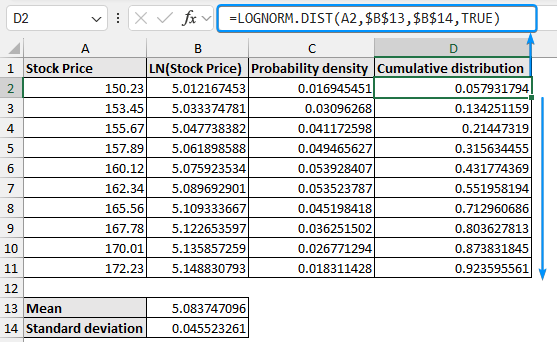

➤ Any non-numeric argument inside the LOGNORM.DIST function returns #VALUE! error.
➤ If x or standard deviation is less than or equal to zero the function returns #NUM! error.FAQ
What is the difference between normal and lognormal distribution?
What is the LOGNORM.INV function in Excel?
=LOGNORM.INV(probability,mean,standard_dev)What are some real-world applications of lognormal distributions?
➤ Finance
➤ Environmental studies
➤ EngineeringCan I use lognormal distribution for negative values?
What is the shape of a lognormal distribution?
Wrapping Up