Probability is the likelihood that a particular event will occur. It is expressed as a number between 0 and 1. You can calculate probability using a built-in Excel function.
➤ Probability is the likelihood that a particular event will occur.
➤ Probability formula: probability = number of possibilities divided by the total outcome.
➤ PROB function: =PROB(x_range, prob_range, lower_limit, [upper_limit]).
➤ If the optional argument is blank the function returns a probability equal to the lower limit.
➤ The PROB function includes the probabilities for both upper and lower limits.
In this article, we’ll learn to calculate probabilities in Excel through different examples using the PROB function.
Overview: PROB Function in Excel
The PROB function returns the probability that values in a range are between two limits or equal to a lower limit.
Syntax
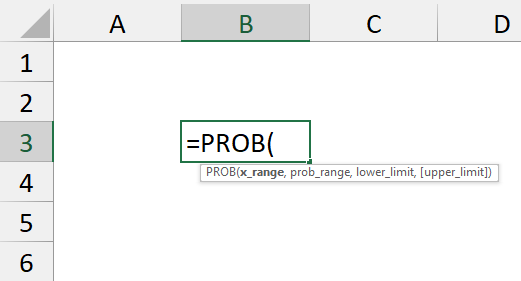
The syntax for the PROB function is given below. It takes 3 mandatory arguments and 1 optional argument.
=PROB(x_range, prob_range, lower_limit, [upper_limit])
➤ x_range: range of numeric value associated with probabilities.
➤ prob_range: probabilities corresponding to x values, between 0 and 1 excluding 0.
➤ lower_limit: lower bound of the value for which probability is calculated.
➤ [upper_limit]: (Optional) upper bound of the value. If omitted, the function returns a probability equal to the lower limit.
Example 1: Probability of Coin Toss
In this dataset, we have the outcome in Column A, the possibility in Column B, and the total outcome in Column C. A coin has two sides (head and tail), so the total outcome is two.
➤ Select the output cell (B5) and use the formula number of possibility over the total outcome. The probability of a head is 0.5.
=B2/C2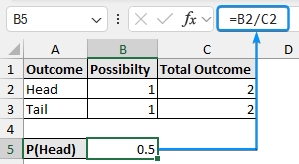
➤ Similarly, calculate the probability for a tail which is 0.5.
=B3/C3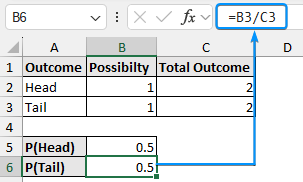
Example 2: Probability of Rolling a Dice
Consider the probabilities of a dice landing on values from 1 to 6. For a fair dice, the probability of each value is 1/6 or 0.167.
One Dice
➤ Calculate the probability of the dice landing on a value between 2 and 5 with the PROB function.
=PROB(A2:A7,B2:B7,A3,A6)=PROB(A2:A7,B2:B7,A4,A5).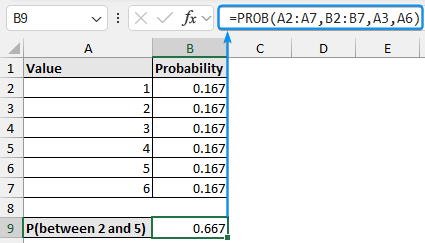
➤ To calculate the probability of the dice landing a score of 5, leave the upper limit blank.
=PROB(A2:A7,B2:B7,A6)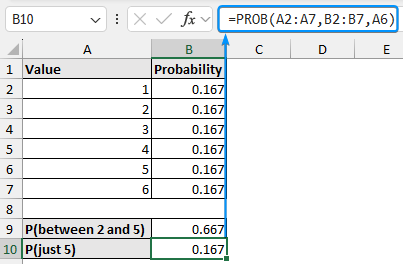
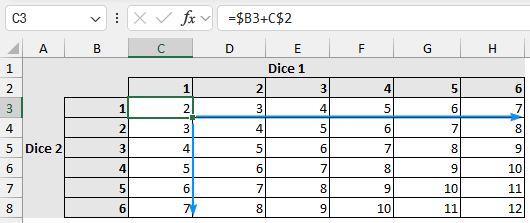
Two Dice
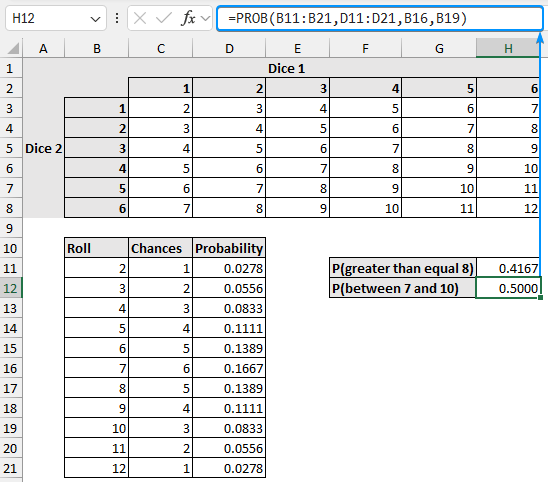
Suppose we are rolling two dice and adding the score of each dice to create a matrix.
➤ Add the scores using the formula. Insert proper dollar signs to lock the columns and rows.
=$B3+C$2
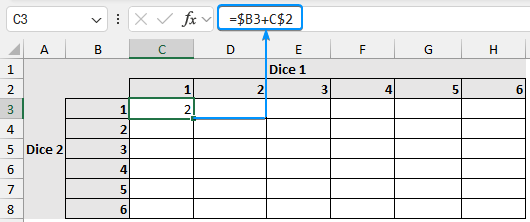
➤ Apply the Fill Handle tool to complete the table.
➤ The roll column lists all the possible scores. The chances column uses the COUNTIF function to count the occurrences.
=COUNTIF($C$3:$H$8,B11)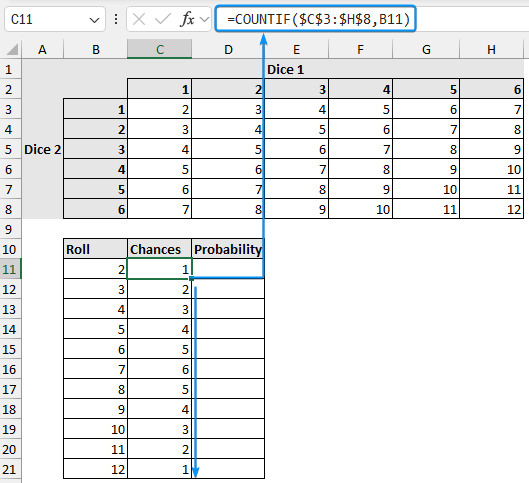
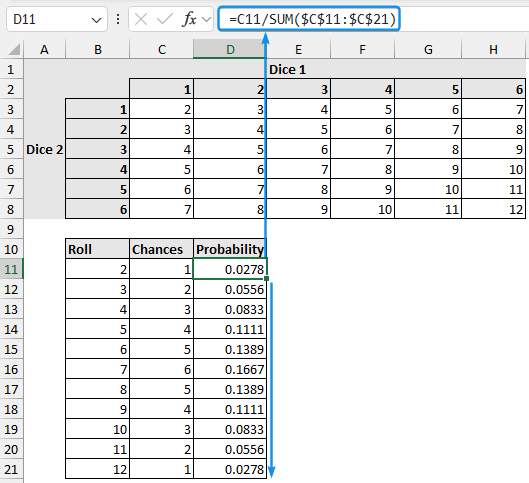
➤ Calculate the probability for each roll using the formula roll divided by the total outcome.
=C11/SUM($C$11:$C$21)
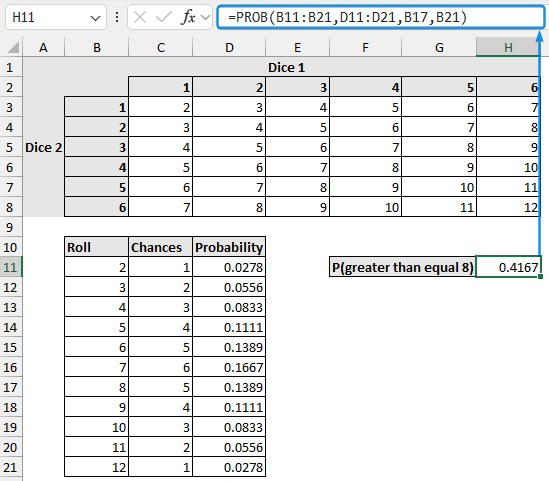
➤ Now, calculate the probability of scoring greater than or equal to 8 by rolling two dice.
=PROB(B11:B21,D11:D21,B17,B21)
➤ The probability of scoring between 7 and 10 is 0.5.
=PROB(B11:B21,D11:D21,B16,B19)
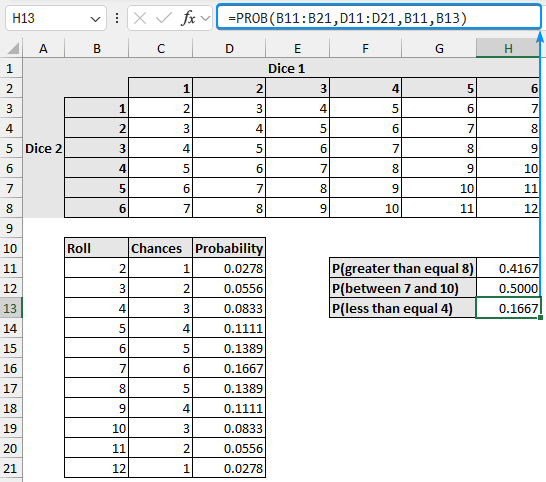
➤ The probability of scores less than or equal to 4 is 0.1667.
=PROB(B11:B21,D11:D21,B11,B13)
Example 3: Real-Life Calculation of Probability in Excel
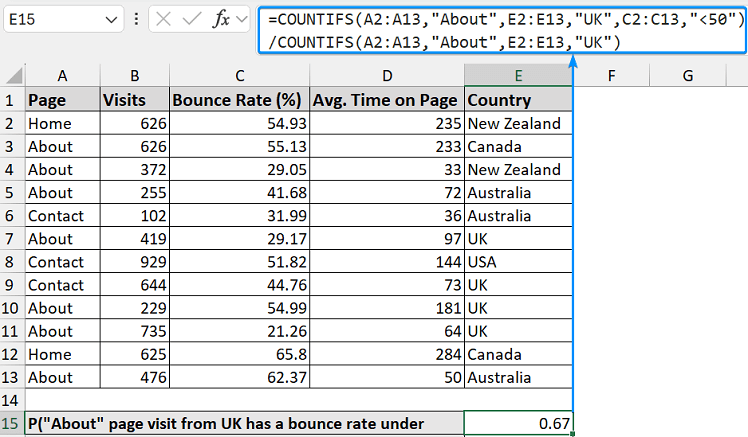
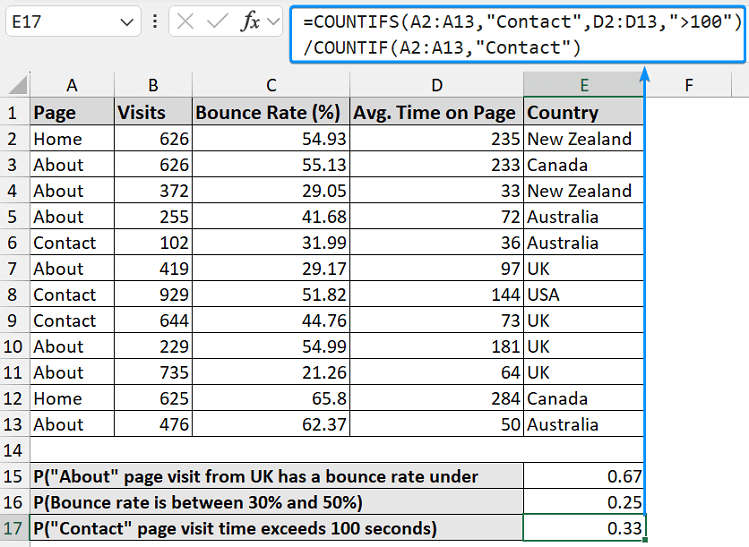
Consider this dataset with page, visits, bounce rate, average time on page, and country outcome in Columns A, B, C, D, and E.
➤ Let’s calculate the probability that an “About” page visit from the UK has a bounce rate under 50%.
=COUNTIFS(A2:A13, "About", E2:E13, "UK", C2:C13, "<50") / COUNTIFS(A2:A13, "About", E2:E13, "UK")
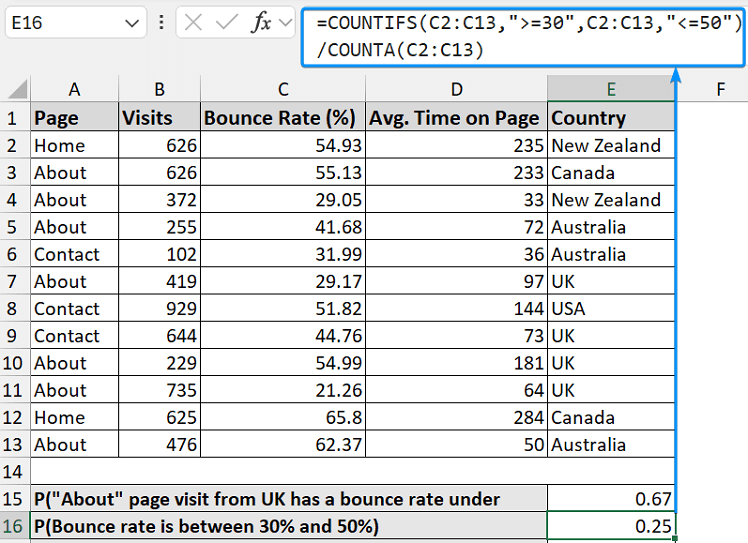
➤ Again, the probability that the bounce rate is between 30% and 50% is:
=COUNTIFS(C2:C13, ">=30", C2:C13, "<=50") / COUNTA(C2:C13)
➤ The probability that the “Contact” page visit time exceeds 100 seconds.
=COUNTIFS(A2:A13, "Contact", D2:D13, ">100") / COUNTIF(A2:A13, "Contact")
Notes:
➤ If a value in the probability range is less than zero or greater than 1, the function returns the #NUM! error.
➤ If all the values in the probability range do not add up to 1, the function returns the #NUM! error.
➤ If x_range and prob_range arguments are different sizes, the function returns the #N/A error.
FAQ
What is the formula of probability in Excel?
=PROB(x_range, prob_range, lower_limit, [upper_limit])
How do you calculate expected probability in Excel?
=SUMPRODUCT(outcome, probability)
How do you calculate the probability of a and b?
P(a and b) = P(a) * P(b)
What is the probability of a or b?
P(a or b) = P(a) + P(b)
How do you calculate conditional probability in Excel?
P(a|b) = P(a ∩ b) / P(b)
Wrapping Up
In this tutorial, we’ve learned to calculate probability in Excel using the PROB function. Feel free to download the practice file and share your thoughts and suggestions.