Excel Charts
How to Sort a Bar Chart in Descending Order in Excel
Learn how to sort a bar chart in Excel in descending order using built-in sort, SORT function, helper columns, axis options, or pivot tables.
Read article

74 articles
Learn how to sort a bar chart in Excel in descending order using built-in sort, SORT function, helper columns, axis options, or pivot tables.
Learn how to add a line to a bar chart in Excel using combo charts, trendlines, extra data series, or vertical average lines for clarity.

Learn how to make a double bar graph in Excel using a preset clustered chart or by manually adding a second series to an existing chart.
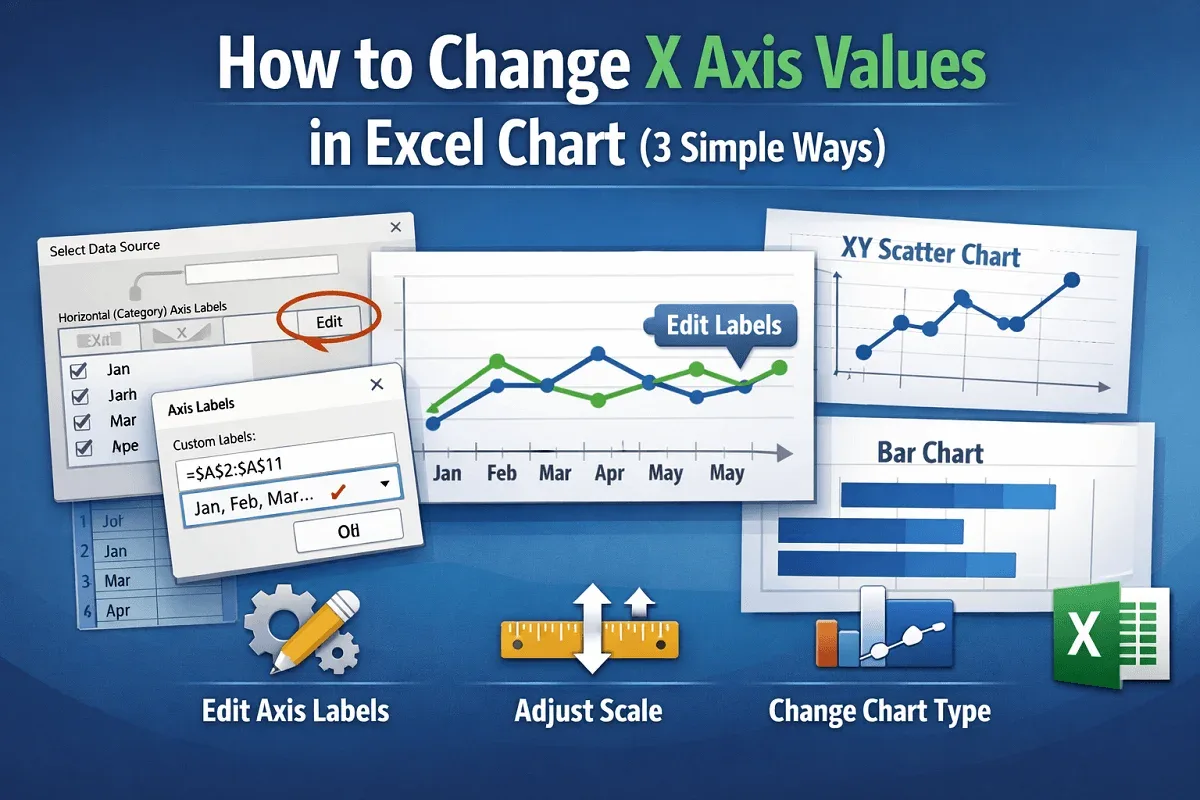
Learn how to change X-axis values in Excel charts by updating labels, adjusting scale and formatting, or switching to a different chart type.
Learn how to select data for a chart in Excel—before or after creating it. Covers adjacent, non-adjacent data, and named range selections.
Learn how to find the equation of a trendline in Excel using built-in features or manual calculations for different trendlines.
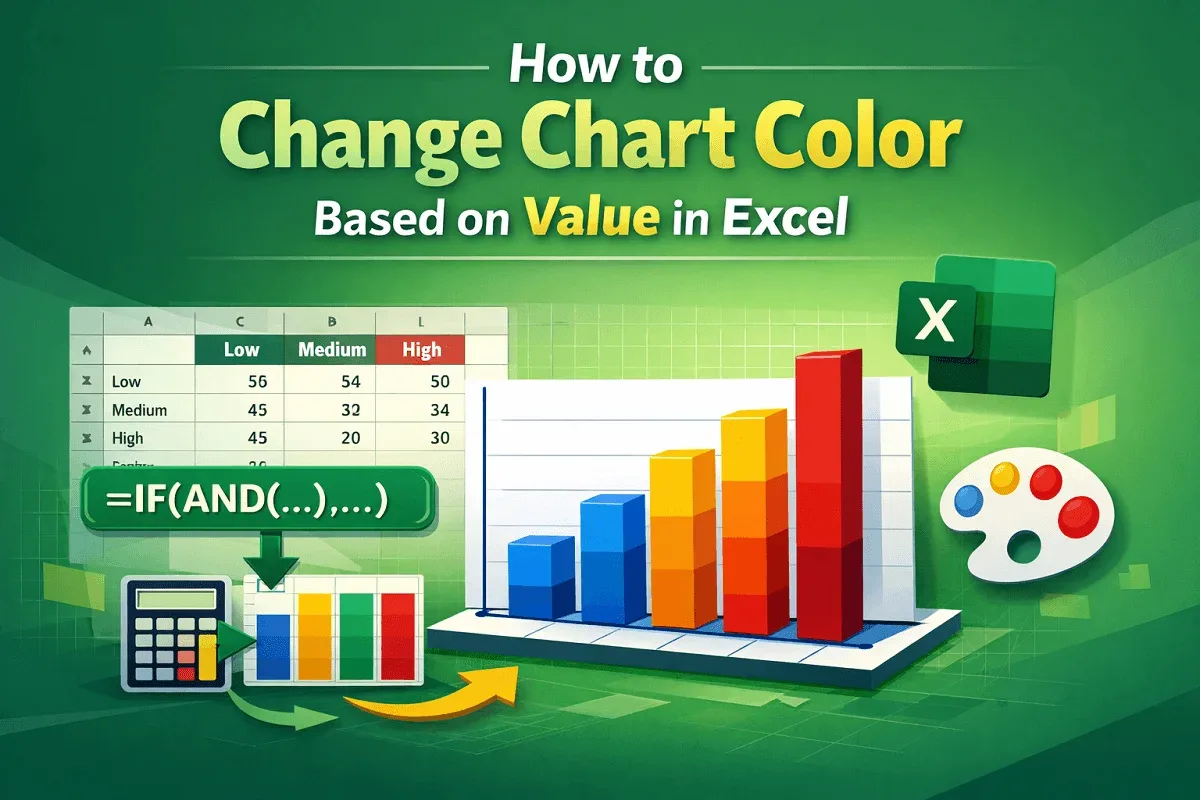
Step-by-step guide to change Excel chart color based on value using formulas for creating dynamic, visually impactful data visualizations.
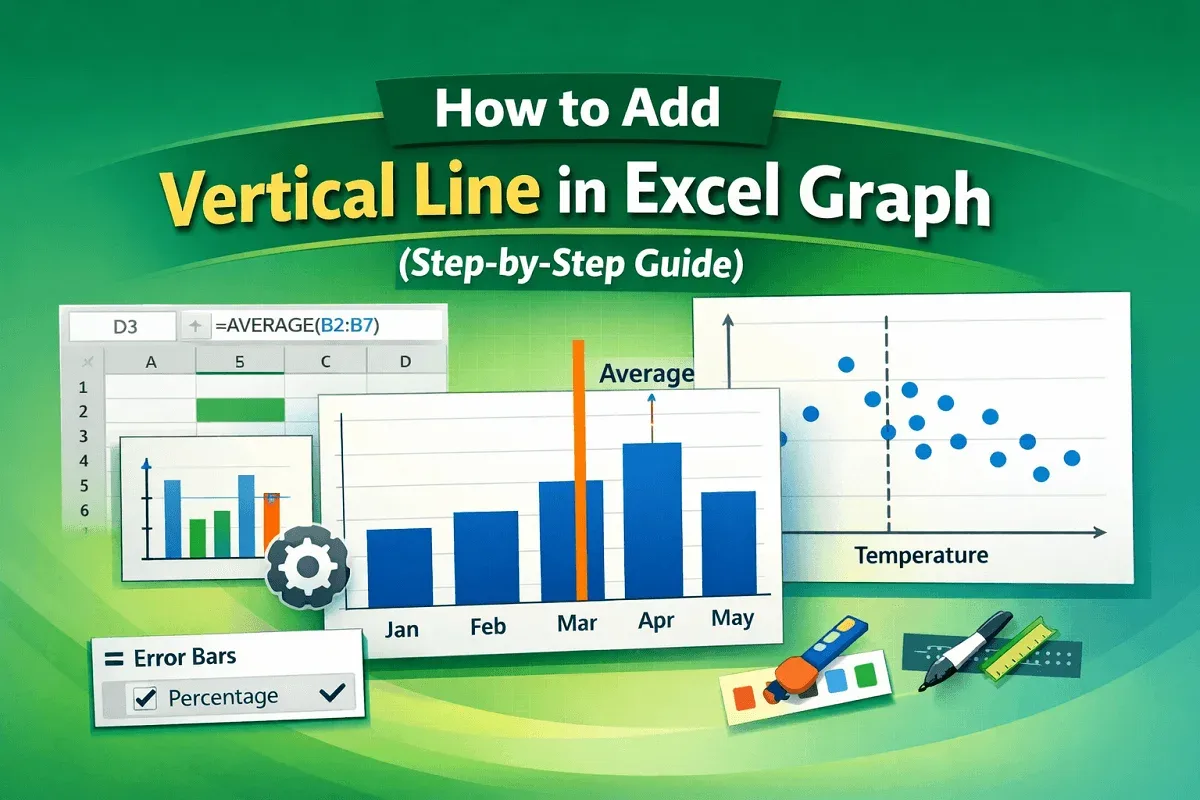
A step-by-step guide to add a vertical line in an Excel graph using error bars and combo charts for highlighting benchmarks.
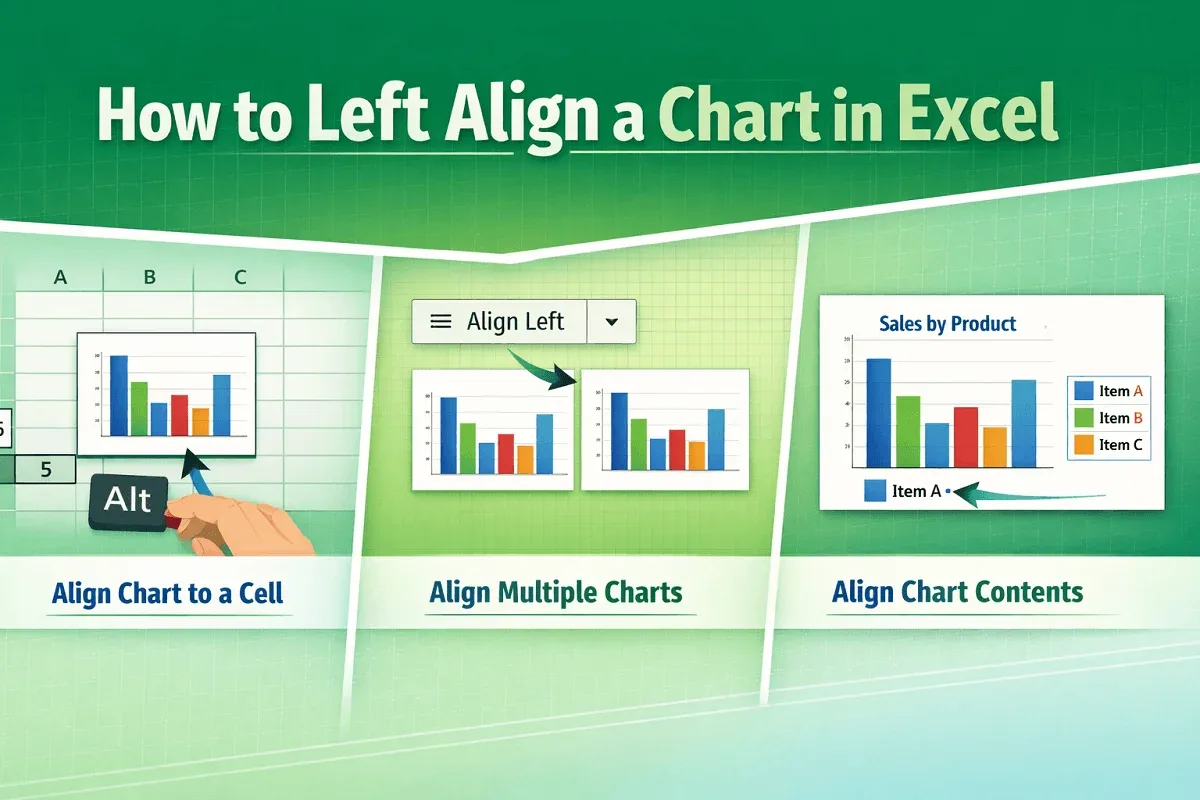
Learn how to left-align a chart in Excel: Align charts to cells, multiple charts together, or chart elements with easy steps.

A step-by-step guide to change axis to logarithmic scale in Excel for better data visualization of exponential data.
Learn how to change axis scale in Excel with a step-by-step guide to adjust bounds, enhance clarity, and highlight key trends in your charts.
Learn how to calculate trend percentage in Excel. Track growth, compare values to a base, and analyze trends with step-by-step instructions.