The legend is a section of the chart that indicates what different colors, lines, and areas mean in the chart.
The legend always shows the color of the data series. So, to change the legend colors, you need to change the color of the series in the graph.
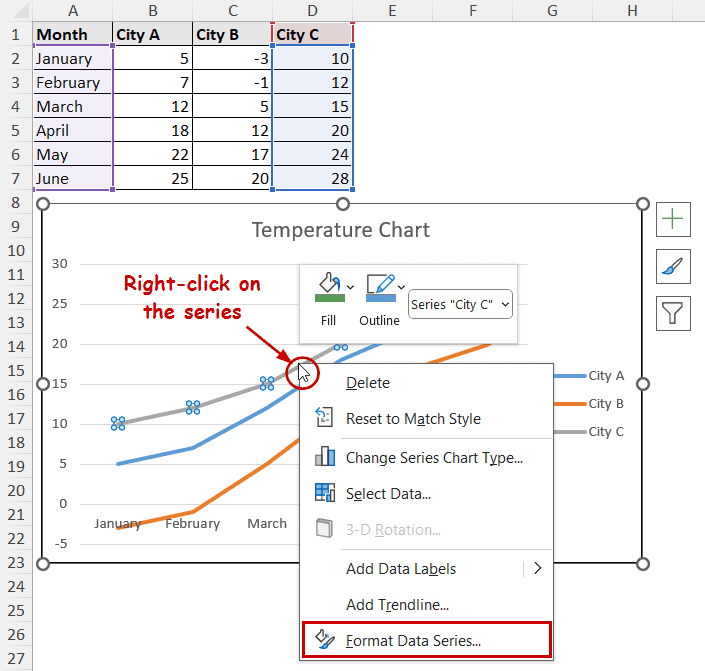
➤ Right-click on a series.
➤ Select Format Data Series from the context menu.
➤ Change the fill color in the Line section of the Fill & Line tab of the Format Data Series pane.
Before we dive into the steps, remember that this is the process of changing the color of a data series.
In this tutorial, we will cover how to change the legend colors in Excel by changing the series color.
Download Practice WorkbookSteps to Change Legend Colors in Excel
Here is the sample dataset and chart we are using for demonstration.
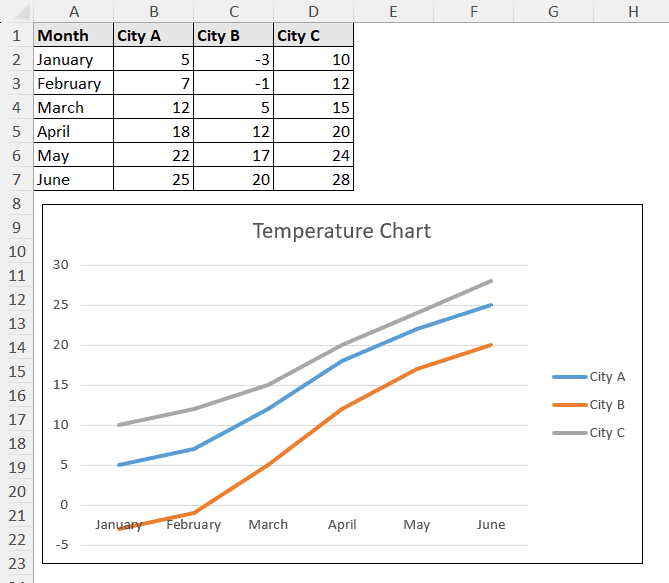
It contains temperatures across three different cities in six different months. We are presenting them with a line chart.
This is the default color for the chart that Excel creates. We will change them to a custom color.
Step 1: Open "Format Data Series" Pane
In Excel 2016 and later versions, every formatting option is included in a different pane. This pane pops up on the right of the sheet after you select the formatting option.
In the prior versions, the options would be available in a dialog box.
To open the pane, right-click on a series and select Format Data Series from the context menu.
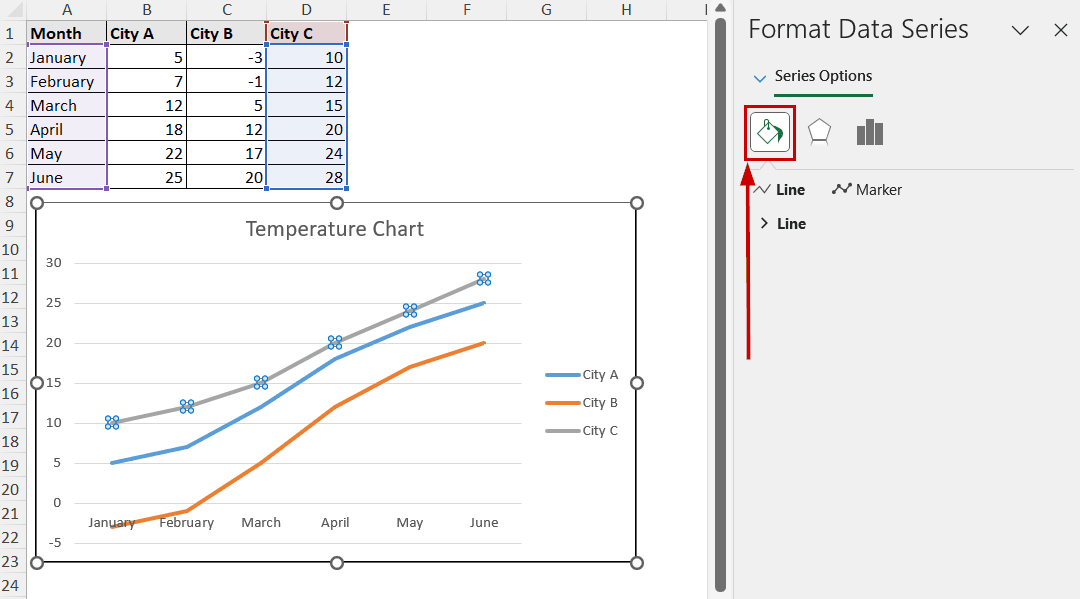
Step 2: Select the "Fill & Line" Tab
In the pane, select the Fill & Line tab.
You can find it in the form of a button of a paint bucket.
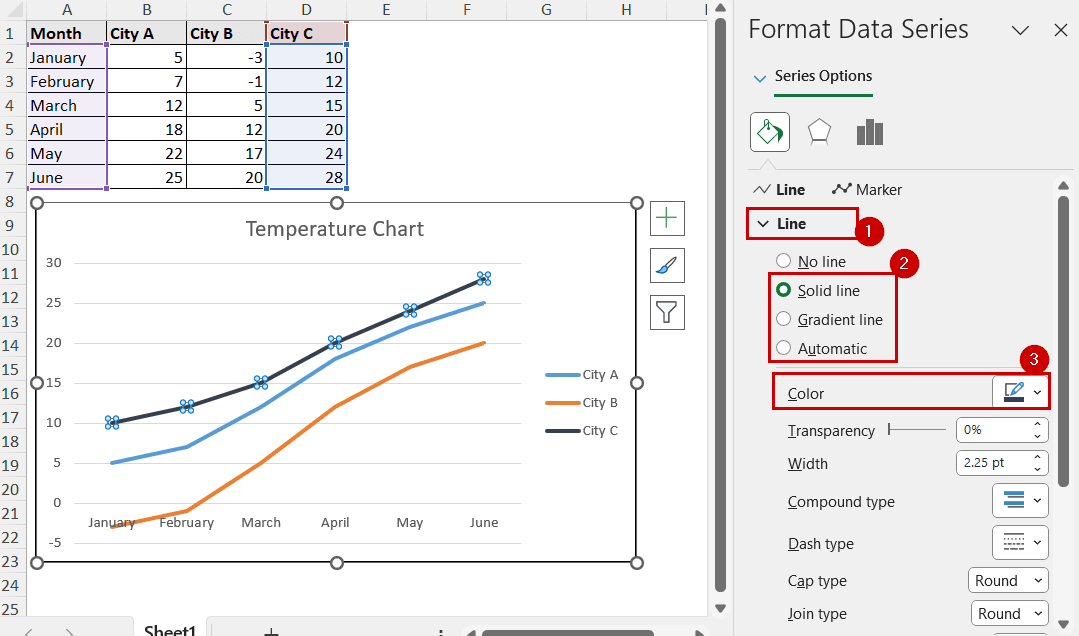
Step 3: Adjust Fill Color
Now select Solid, Gradient, or Automatic under the Line section. This is the line style you prefer.
Under that, you will find the Color option.
Select a color from here and the series color will change.
The legend color will also change accordingly.

Frequently Asked Questions
How do I change the font color of a legend?
To change the font color, right-click on the legend and select the Format Legend option from the context menu. A similar “Format Legend” pane will appear on the sheet. Under the Text options, change the fill color there.
Why doesn’t the legend color change when I change the data series color?
The legend should always change with the data series’ color. If it isn’t happening, ensure that the color change is applied correctly. Also, if you create a custom legend with text box objects, it won’t change the legend color with the data series. Since they are not linked.
How do I reset the legend colors to their default settings?
To reset the legend colors, you need to reset the series colors. To revert a series color back to normal, right-click on the series and select Reset to Match Style from the context menu.
Wrapping Up
In this tutorial, we have covered how to change legend colors in Excel. In doing so, we have demonstrated how to change the color of a data series in an Excel chart.
This is because the two are connected if the legend was created in Excel.
Feel free to download the practice file and let us know about your feedback.