Cash flow diagrams help show insights into the cash inflows and outflows of a business. People who are not familiar with accounting can find regular data ranges hard to interpret. To make the data understandable to them, we are going to learn how to create a cash flow diagram in Excel.
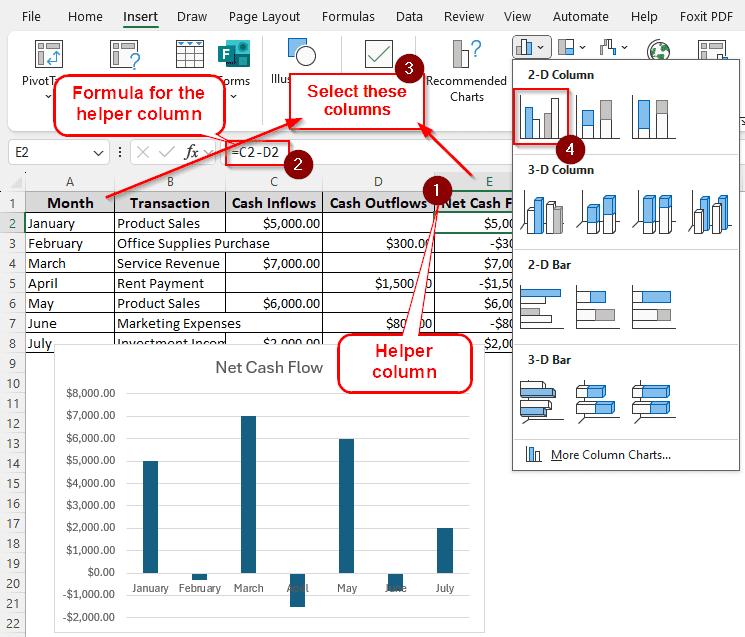
➤ Create a helper column for the net cash flow using the cash inflows and outflows. Use the formula below:
=C2-D2
➤ Replace C2 with the inflow and D2 with the outflow, then autofill the whole column.
➤ Select the column of dates and the column of the net cash flows.
➤ Go to the Insert tab and select your desired 2-D Column from the Charts section.
That might seem like a lot of steps, but it’s actually easier than it looks. In this tutorial, we will describe the process of creating a cash flow diagram in detail so that you can do it too. Therefore, download the workbook we used for this article to follow along, and read the whole tutorial to learn the methods properly.
Creating a Cash Flow Diagram Using Net Cash Flow
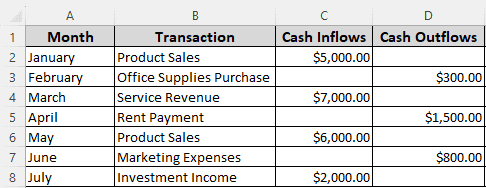
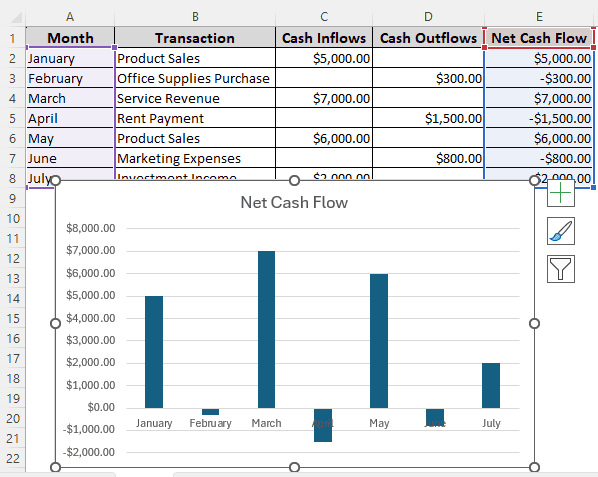
In this example, we have the cash flow of seven months from the beginning of the year. We want to create a diagram that will show the inflows and outflows in a chart with 2-D columns. Follow the steps below to proceed:
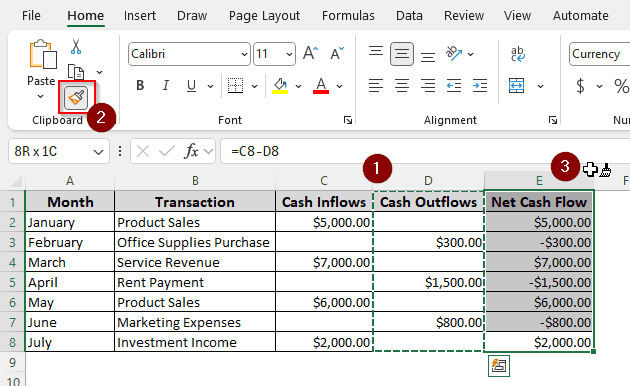
➤ Write Net Cash Flow in the E1 cell, and the following formula in the E2 cell:
=C2-D2
➤ Use your mouse to find the plus (+) sign on the lower right of the E2 Drag that to the end of the E8 cell to fill the whole row up.

➤ Since this is a regular data range and not a table, the formatting of the other columns isn’t automatically copied to the E To do that, select D1 to D8 cells, and press the Format Painter icon from the Clipboard section of the Home tab.
➤ Select from E1 to E8 cells to copy the format.
➤ Hold Ctrl and drag your mouse through E1:E8 and A1:A8 to select those columns.
➤ Go to the Insert column and find the Charts Click on the Insert Column or Bar Chart icon to locate a bunch of charts that we can use for this data.
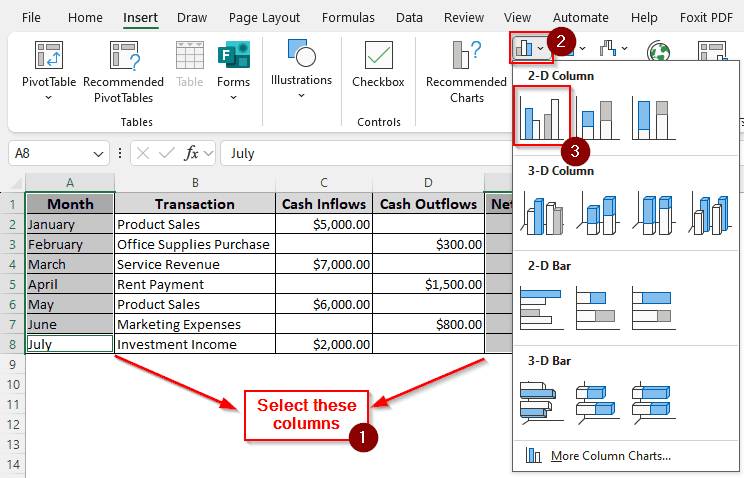
➤ Select the first chart from the 2-D Column section.
Including Inflows, Outflows, and Cumulative Cash Flows in the Diagram
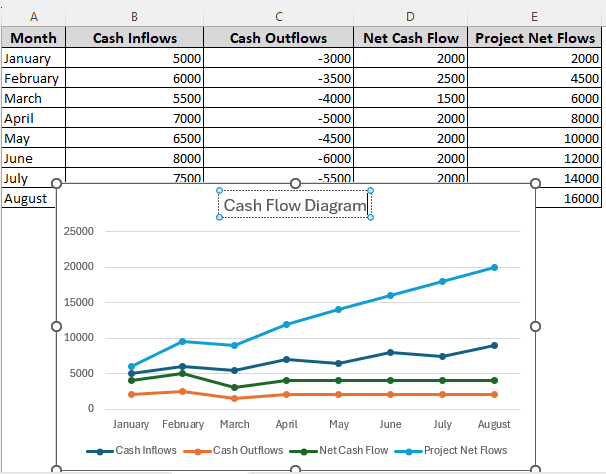
In the previous method, we had to create the net cash flow column and add the net flows in the cash flow diagram. But for this dataset, we have cash flow information from a project management perspective, where there are inflows and outflows, but we have to calculate the net flows and project net flows to create the diagram. The project net flows are the cumulative cash flows that will help understand the future of the project. Let’s see how this method works:
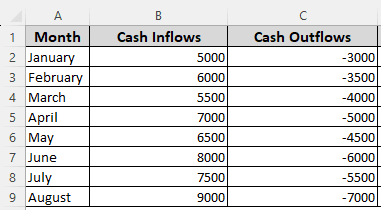
➤ Add two columns for the Net Cash Flow and Project Net Flows.
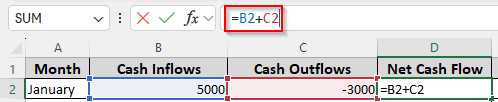
➤ Calculate the Net Cash Flow like we did before, so the formula will be like below:
=B2+C2
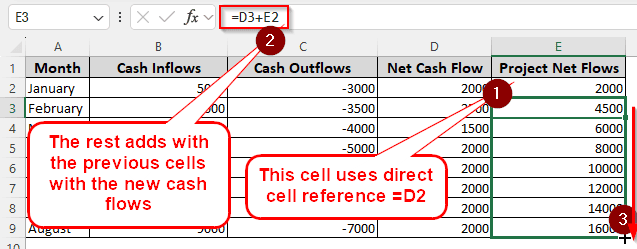
➤ To calculate the Project Net Flows, write this formula in the E2 cell (Assuming E is the column for the Project Net Flows)
=D2
➤ For E3 cell, write this:
=D3+E2
➤ Autofill other rows in the column using your mouse.
➤ Select the whole data range now, and go to the Insert From the Charts section, select Stacked Lines with Markers
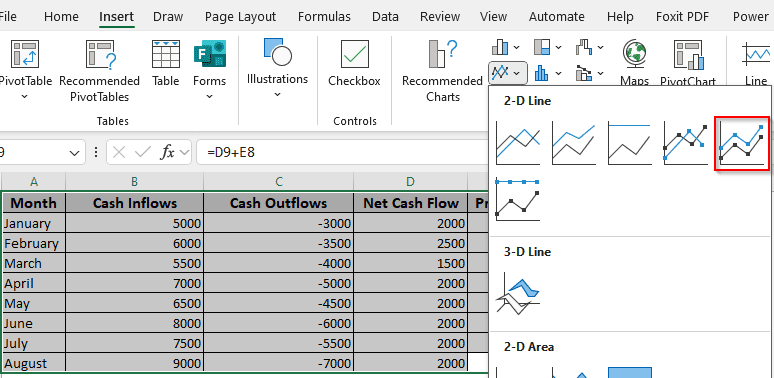
➤ Click on Chart Title and rename the chart to Cash Flow Diagram
Drawing Cash Flow Diagram with Combo Layout
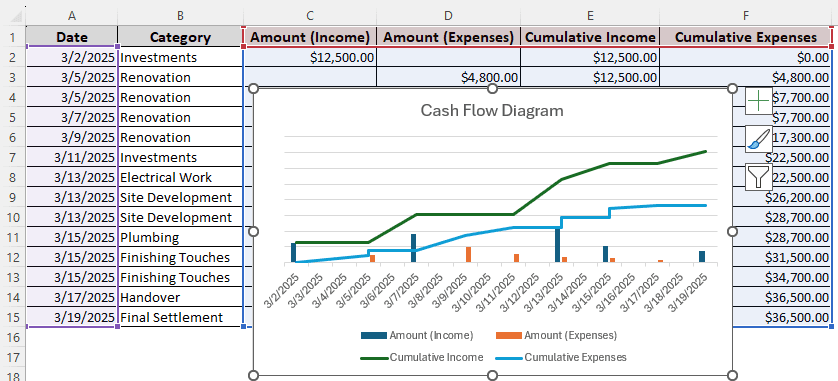
For this example, we have a large dataset with incomes and expenses, which are our cash inflows and outflows. Moreover, we have cumulative incomes and expenses as well which we will have to include in the diagram. Let’s get into it.
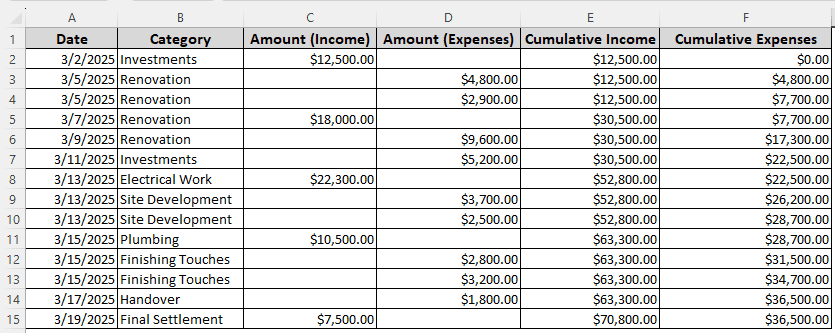
➤ Select all of the columns from the dataset except Category.
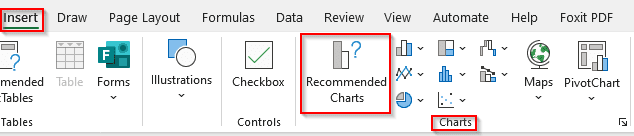
➤ Go to the Insert tab and head to Charts > Recommended Charts
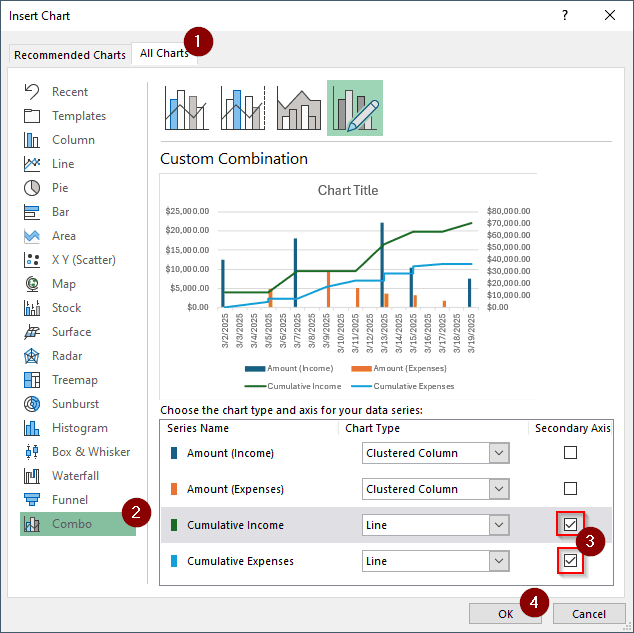
➤ From the new window, go to the tab called All Charts
➤ Select Combo from the left panel. It should be on the bottom.
➤ The Cumulative Income and Cumulative Expenses should be Lines by default. Mark them as Secondary Axis so that the lines go by the numbers that will be shown on the right.
➤ Rename Chart Title to Cash Flow Diagram.
➤ Delete the numbers from the left and right (Vertical and Horizontal axes) to make the chart look better.
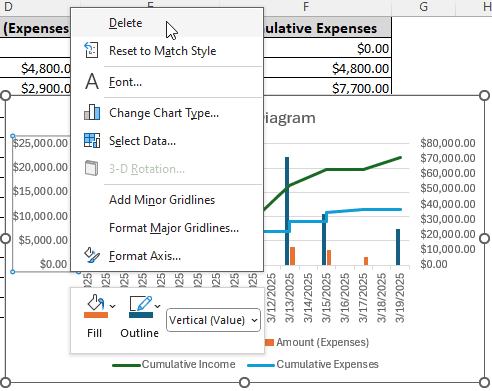
➤ Now we have a distraction-free, clear view of the cash flow diagram.
Frequently Asked Questions
How to use cash flow function in Excel?
To find out the total cash flow of your business, use this formula:
=SUM(C2:C8)-SUM(D2:D8)
Replace C2:C8 with the cell range of your cash inflows, and D2:D8 with the cell range of your cash outflows. This formula adds up all the cash inflows and subtracts all of the cash outflows from that.
What is the formula for daily cash flow?
You can calculate that by summing up both the cash inflows and outflows in separate cells. After you do that, subtract the outflows from the inflows using this formula:
=A1-B1
Here, A1 is the summation of the cash inflows, and B1 is the summation of the cash outflows.
How to find cash flow ratio?
There are a few types of cash flow ratios, each with a different formula to calculate. However, the general formula is this:
=A1/B1
Here, A1 is the net cash flow, and you divide it by B1, which is the value that you are calculating your cash flow against.
How to calculate operating cash flow?
The formula for calculating operating cash flow is as follows:
=A1-B1
In this formula, A1 is the summation of the cash received from sales, and B1 is the summation of all the operating expenses.
Why do we calculate cash flow?
Cash is arguably the most important part of the day-to-day operations of a business. By calculating cash flow, we can determine the amount of money that flows in and out of the business, which helps track whether the business has sufficient liquid cash to sustain its operations.
Wrapping Up
In this article, we learned about cash flow diagrams in Excel and how to create one for yourself. Download the practice workbook, as it has all the data ranges and the diagrams so that you can understand the methods used in this article better. Leave your concerns below if you have any. We will be looking forward to sharing more Excel tutorials with you soon.