If you are a data analyst or want to be one, you must know how to forecast in Excel based on historical data. In today’s world, almost every business needs to run forecasts for its operations. Fortunately, there are multiple ways to do this in Excel. In this article, you will learn four ways you can forecast in Excel based on historical data.
➤ Write the formula in the cell where you want the forecast:
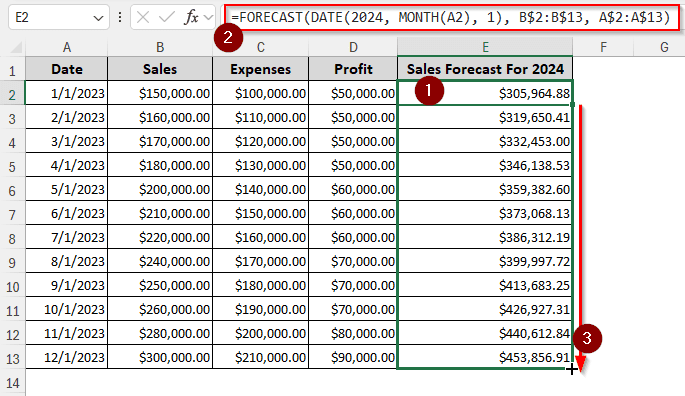
=FORECAST(DATE(2024, MONTH(A2), 1), B$2:B$13, A$2:A$13)
➤ Replace DATE(2024, MONTH(A2), 1) with the date for which you want the forecast, B$2:B$13 with the historical data, and A$2:A$13 with the date of the historical data.
➤ Press Enter, and autofill the other cells you want a forecast for.
While this method will be enough for a lot of people, you might be intrigued to know all the other methods there are to calculate forecasts. We have almost all the methods to calculate forecasts based on historical data lined up for you. Therefore, read the whole tutorial to understand the methods clearly.
Forecasting with the Linear Approach
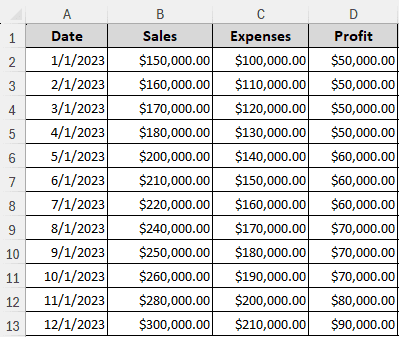
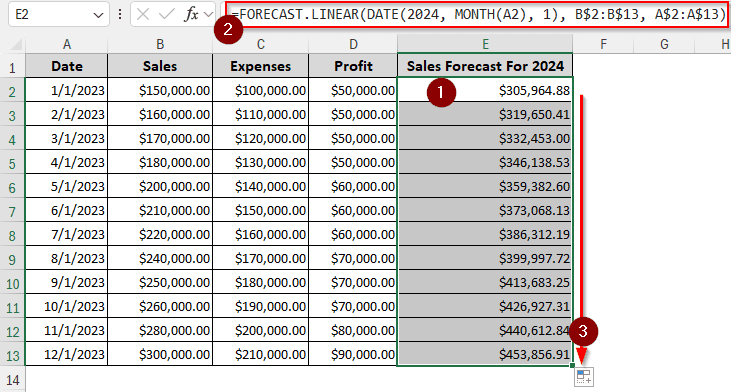
For this example, we have a dataset with the sales, expenses, and profit data for 2023. With this information, we need to forecast the sales for 2024. Microsoft Excel provides us with some dedicated functions for forecasting purposes. The FORECAST function is available even in older versions of Microsoft Excel, but recently it has been renamed to FORECAST.LINEAR. Let’s use this function to do the forecasting:
➤ First, create another column for the sales forecast. We are using column E with the heading “Sales Forecast for 2024”.
➤ In E2 cell, write this formula:
=FORECAST.LINEAR(DATE(2024, MONTH(A2), 1), B$2:B$13, A$2:A$13)
The second parameter for forecasting is the historical data, which resides in B$2:B$13 cells. The third parameter is the dates for the historical data, which are from column A$2:A$13. We are using the dollar sign ($) for both column A and column B so that excel does not change these references while autofilling.
➤ Press Enter and drag the plus (+) sign from the bottom-right of E2 cell to E13 cell to autofill the column.
Note:
If you are using Excel 2013 or earlier, change FORECAST.LINEAR to FORECAST for the function name.
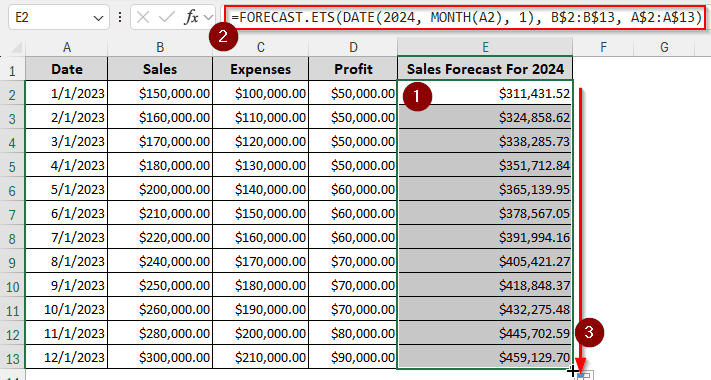
Using Exponential Smoothing to Forecast
Another popular method for forecasting is using exponential smoothing. This method is not available in Microsoft Excel versions older than 2016. However, if you are using Microsoft 365, you don’t have to worry about the Excel version. Here is how to use this method:
➤ After creating a separate column for the forecast, write this formula to do the calculation:
=FORECAST.ETS(DATE(2024, MONTH(A2), 1), B$2:B$13, A$2:A$13)
➤ Press Enter, and autofill the rest of the rows in the column.
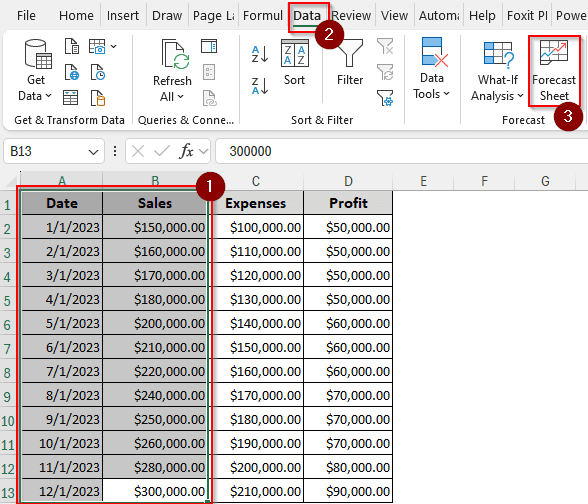
Utilizing a Separate Forecast Sheet
We can use formulas all we want, but using a graph and a forecast sheet will be the most preferred method for most analysts. It makes it easier to understand for people who aren’t into statistics, and it’s easy to make. Follow the steps below to create a forecast sheet with a graph:
➤ Select the date column (A) and the historical data column (B).
➤ Go to the Data tab and select Forecast Sheet from the Forecast section.
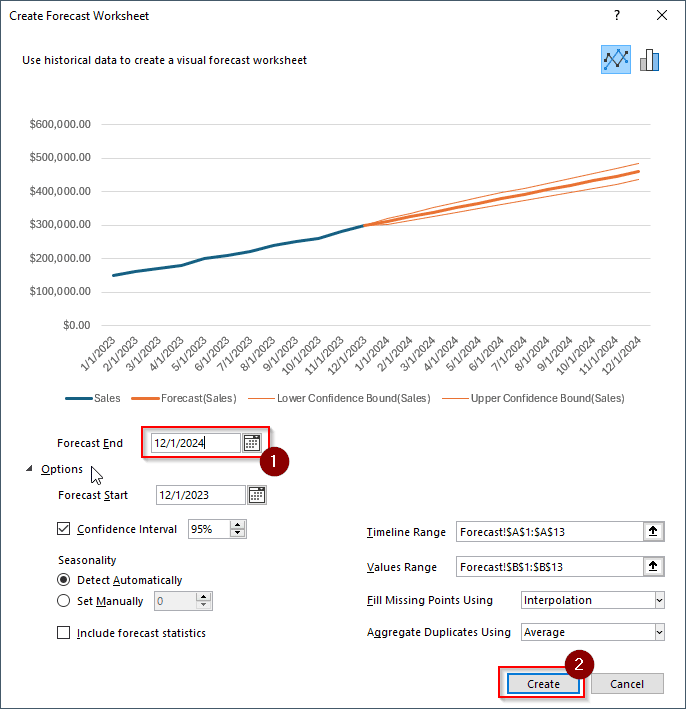
➤ From the new window, open Options. There is a lot of stuff you might want to change here. But for this example, we don’t even need the Options. We can change the Forecast End date to 12/1/2024 and hit Create.
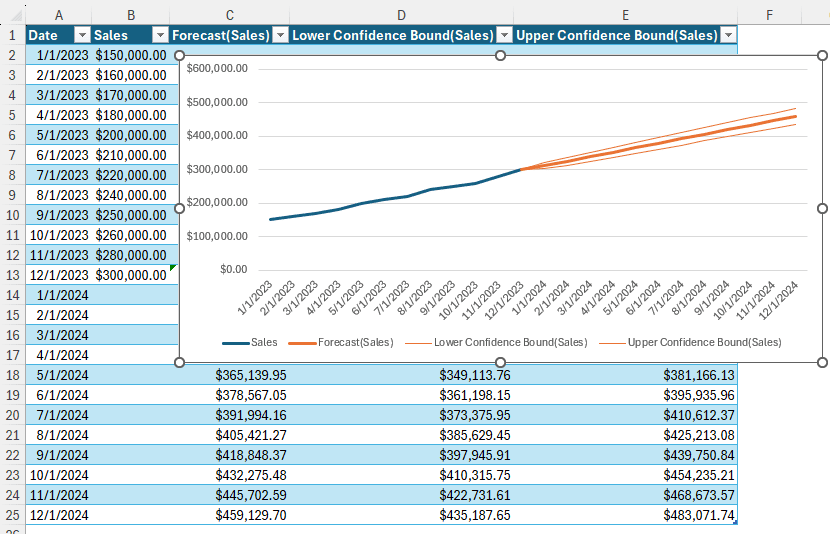
➤ A new sheet will be created. In this sheet, you will find a new table with the forecasted data and a graph with a visual representation of the data. The blue lines in the graph are the historical data, and the orange ones are the forecasted data.
Calculating Forecast Using Moving Average
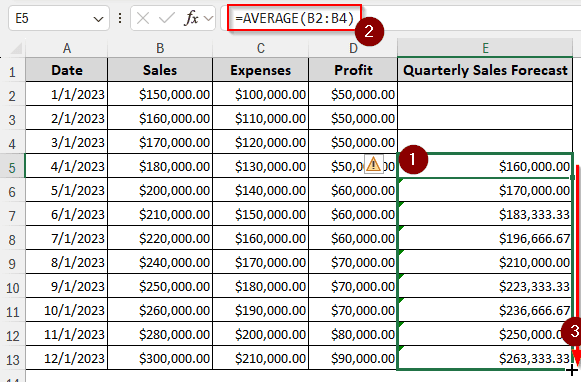
If all those methods are too complicated, you can use the simple moving average method to forecast using historical data. Instead of calculating the forecast for an entire year, we will be doing a quarterly forecast using the data we have used so far in this tutorial. Follow the steps below:
➤ Create a column for Quarterly Sales Forecast. We are doing it in column E.
➤ In E5 cell, write this formula:
=AVERAGE(B2:B4)
➤ Autofill the cells till E13 so that the moving average actually moves until the end of the year.
Frequently Asked Questions
What tool is useful for forecasting using historical data?
The functions provided by Microsoft Excel are enough for doing forecasting using historical data. But if you want to do advanced forecasts, you should use dedicated business data analysis programs like Tableau.
How to check forecast accuracy in Excel?
When you have the actual data, you can calculate forecast accuracy by subtracting the forecasted data from the actual data. Here is the formula for doing that:
=A1-B1
Replace A1 with the actual data, and B1 with the forecast data.
What is the confidence level in forecasting?
The confidence level is basically how accurate your forecast can possibly be. You can calculate this in Excel using the following formula:
=FORECAST.ETS.CONFINT(A1,B1:B10,C1:C10)
Replace A1 with the target date for forecasting, B1:B10 with the historical data, and C1:C10 with the timeline of historical data.
What is forecast based on a historical time series?
The forecast method for historical data is time series forecasting. In this method, a lot of data from previous times is aggregated to calculate the forecast for the new dates.
What is the best forecast method in Excel?
There is no best forecasting method in Excel. You can try all of them and then compare them with actual data to find out which method works best for you.
Wrapping Up
In this article, we have tried our best to show you how to forecast in excel based on historical data. We hope that you have been able to learn the methods used in this tutorial. Leave your concerns and comments below, and don’t forget to download the workbook used in this article for free.