A confidence interval helps you understand the accuracy of your data estimates beyond simple averages. In this tutorial, you’ll understand what a confidence interval is and how to calculate confidence intervals in Excel. Whether you’re tracking performance indicators, creating reports for clients, or studying health trends, this blog helps you understand the range your data represents, leading to more reliable conclusions.
➤ A confidence interval provides a range where the true population parameter lies. ➤ Enable Data Analysis: File >> Options >> Excel Add-ins >> Data Analysis. In this article, we’ll learn how to calculate confidence interval using Excel’s statistical functions and the Data Analysis ToolPak Add-in.
➤ Using Excel functions:=AVERAGE(cell_reference)=STDEV.S(cell_reference)=COUNT(cell_reference)=CONFIDENCE.T(1-confidence level,standard_dev,size)=Mean+Confidence=Mean−Confidence
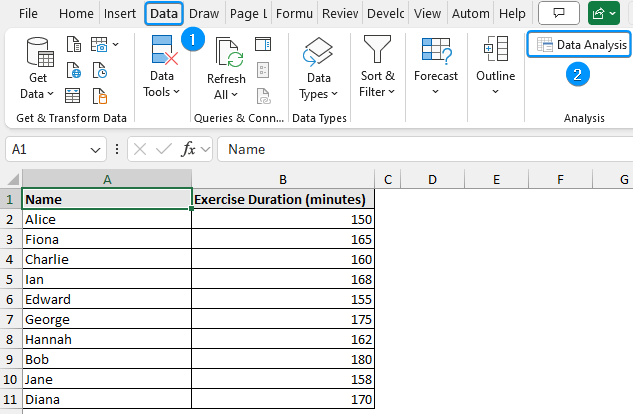
➤ Using Data Analysis ToolPak: Data tab >> Data Analysis >> Descriptive Statistics >> Input range >> Labels >> Output range >> Summary statistics >> Confidence level.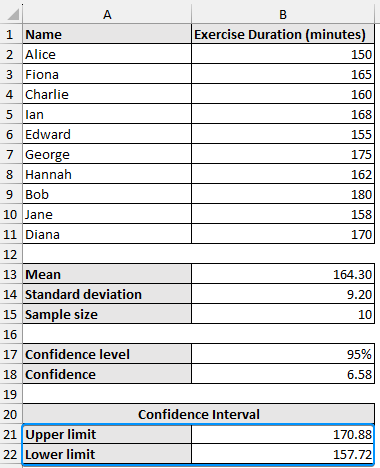
What is Confidence Interval in Statistics?
A confidence interval is a range where the true population parameter is expected to lie. For instance, a 95% confidence interval indicates a 95% chance that the true population mean falls inside the interval. It reveals the precision of the sample estimate and is widely used in the fields of data analytics, statistics, quality control, etc.
Calculating Confidence Interval with Excel Functions
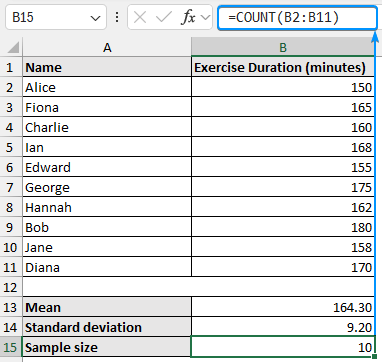
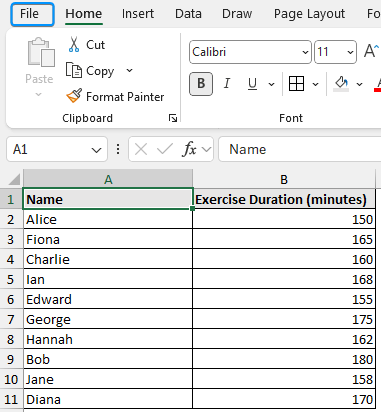
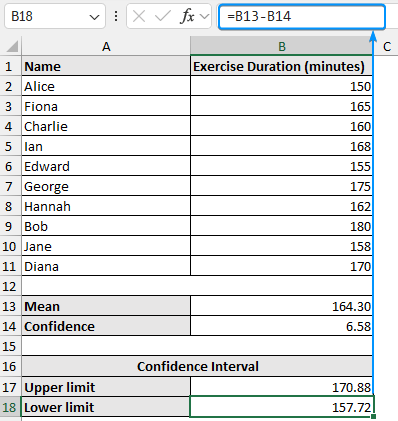
The exercise duration dataset contains the names and exercise duration (in minutes) in columns A and B.
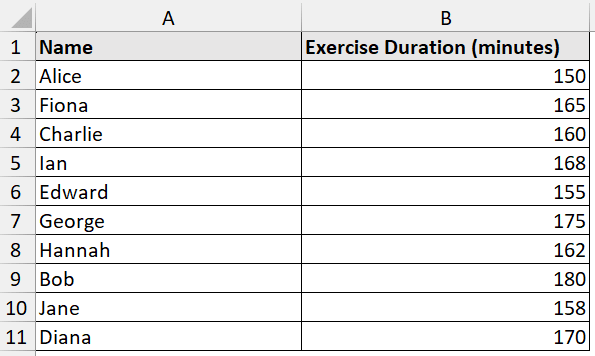
Suppose you are evaluating exercise data for a sample group of customers. You want to calculate the average exercise duration and also include your level of confidence in that average. Using Excel, let’s calculate the average exercise duration and make a 95% confidence interval around the mean to better understand the variability of the data.
The confidence interval will be calculated using the Excel functions AVERAGE, STDEV.S, COUNT, and CONFIDENCE.T. It’s a great approach to learn the calculations step by step. In addition, this method is well suited to medium to small sized datasets and when the population standard deviation is not known.
Steps:
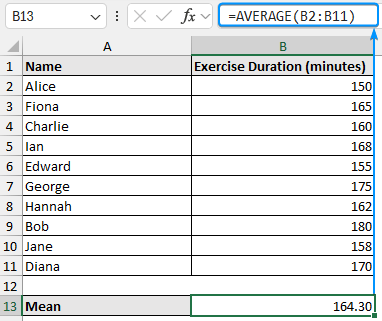
➤ Select the output cell (B13) and use the AVERAGE function.
=AVERAGE(B2:B11)
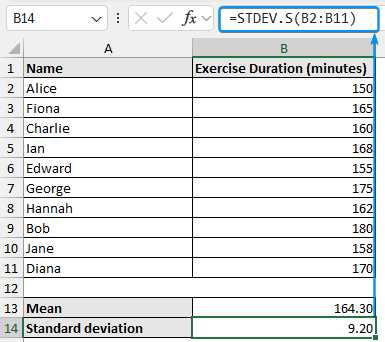
➤ Use the STDEV or STDEV.S function to calculate the sample standard deviation.
=STDEV.S(B2:B11)
➤ Apply the COUNT function to count the sample size.
=COUNT(B2:B11)
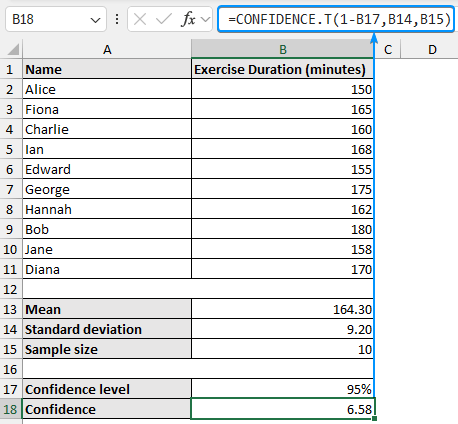
➤ Enter a suitable confidence level (90%, 95%, 99%). The most commonly used is 95%.
➤ In cell B18, enter the formula below for the confidence value (margin of error).
=CONFIDENCE.T(1-B17,B14,B15)
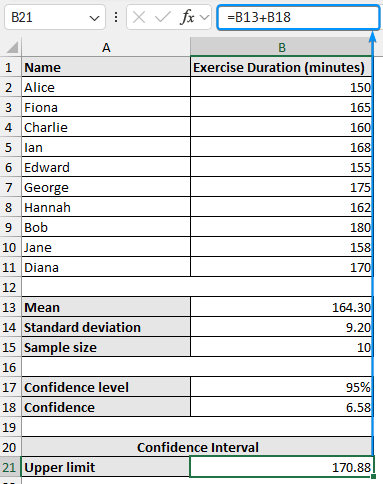
➤ For the upper limit of the confidence interval add the confidence value with the sample mean.
=B13+B18
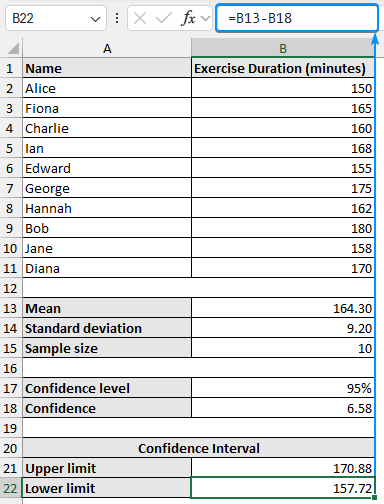
➤ Subtract the confidence value from the sample mean to get the lower limit.
=B13-B18
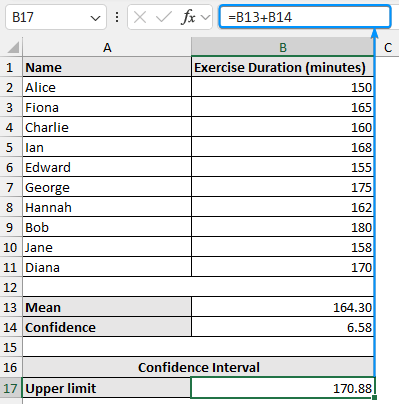
➤ The margin of error (confidence) is 6.58 minutes.
➤ The 95% confidence interval is 170.88 to 157.72 minutes.
➤ Based on our sample data, we are 95% confident that the actual average (population mean) exercise duration lies in the interval 170.88 to 157.72 minutes.
Using Data Analysis ToolPak to Calculate Confidence Interval in Excel
Excel’s Data Analysis Toolpak is an alternative to calculating confidence interval in Excel if you prefer to avoid formulas and functions. This method is perfect for quickly obtaining summary statistics, such as the confidence interval, without formulas and functions. It’s particularly useful for beginners or for making fast checks. Before you start, just make sure the Data Analysis Toolpak is activated, or follow the steps.
Steps:
➤ Click on the File tab.
➤ Select Options. You can also use the shortcut Alt + F + T to open Excel Options.
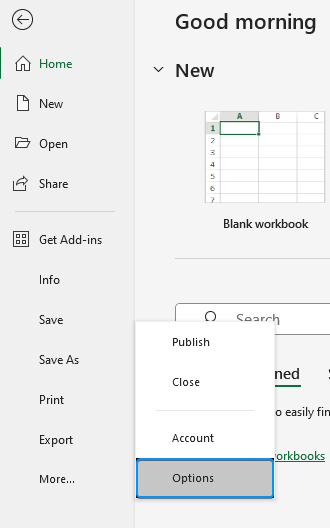
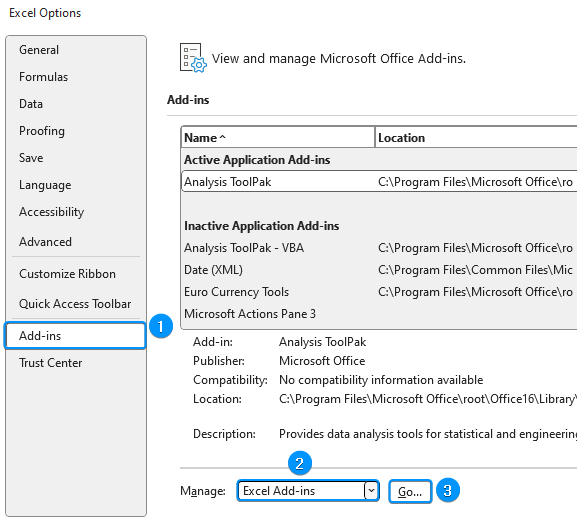
➤ Select Add-ins >> Choose Excel Add-ins from the dropdown >> Go.
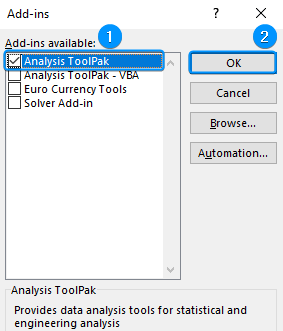
➤ Check the Analysis ToolPak option >> OK.
The Data Analysis option will be available in the Data tab whenever you open a new workbook.
➤ Go to the Data tab >> Click Data Analysis.
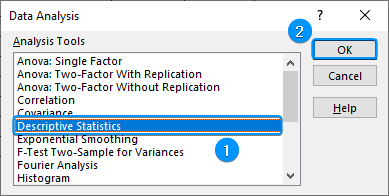
➤ Select Descriptive Statistics >> OK.
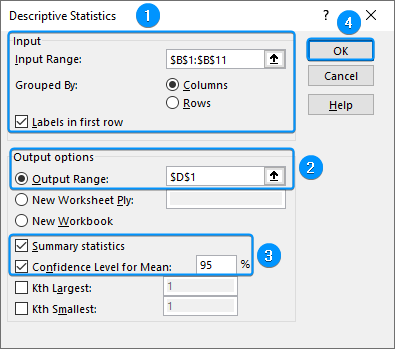
➤ Select the input range (B1:B11) >> Tick the option “Labels in first row”.
➤ Choose the output cell (D1) >> Check Summary Statistics and Confidence Interval for Mean. You can set a confidence interval of your choice.
➤ You’ll get the same results as before.

➤ Calculate the upper limit of the confidence interval.
=B13+B14
➤ Obtain the lower limit of the confidence interval.
=B13-B14
The results have been discussed in detail previously.
FAQ
How do I calculate the 95% confidence interval in Excel?
=CONFIDENCE.T(0.05,standard_dev,size)
How to find the lower bound and upper bound in Excel?
➤ Calculate the confidence or margin of error value with =CONFIDENCE.T(alpha,standard_dev,size)
➤ Upper bound: <strong>=Mean+Confidence</strong>
➤ Lower bound: <strong>=Mean−Confidence</strong>
What is CONFIDENCE.NORM and CONFIDENCE.T function in Excel?
➤ CONFIDENCE.NORM: calculates the confidence interval of a population mean using normal distribution.
➤ CONFIDENCE.T: calculates the confidence interval for a population using the T distribution.
How to calculate the Z value for a 95% confidence interval in Excel?
=NORM.S.INV(0.025)
What is the T-value for a 95% confidence interval in Excel?
=T.INV.2T(0.05,deg_freedom)
CONFIDENCE.T vs. CONFIDENCE.NORM Functions
➤ CONFIDENCE.T: suitable for small sample sizes and when the population standard deviation is unknown.
➤ CONFIDENCE.NORM: well suited for large sample size and when the population standard deviation is known.
Wrapping Up
In this tutorial, we’ve learned about confidence intervals and how to calculate confidence interval using Excel functions and Data Analysis ToolPak. Feel free to download the practice file and share your thoughts and suggestions.