We’ve all fitted a line to data points and calculated its slope. But how certain is that slope? This tutorial will answer the question of how to find the uncertainty of slope using Excel. A clear understanding of slope uncertainty is very important, whether you are forecasting sales, evaluating student performance, or performing regression analysis.
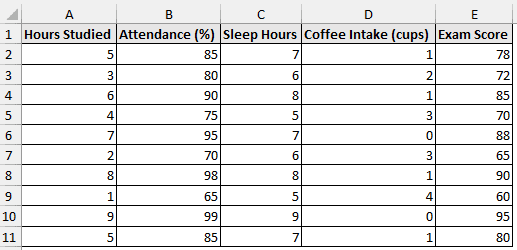
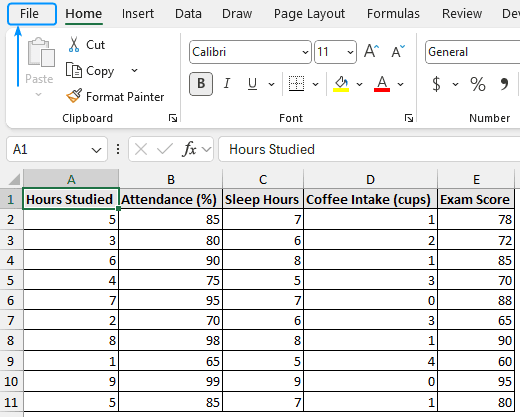
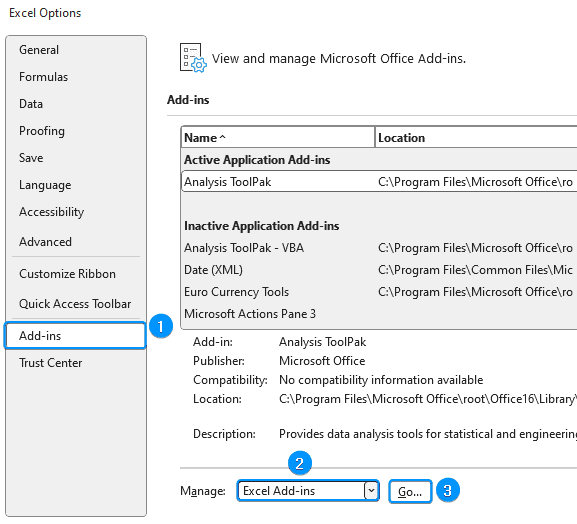
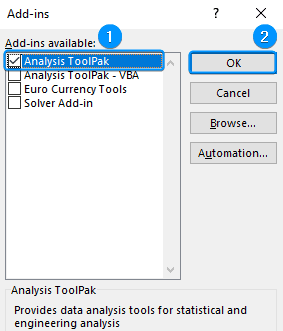
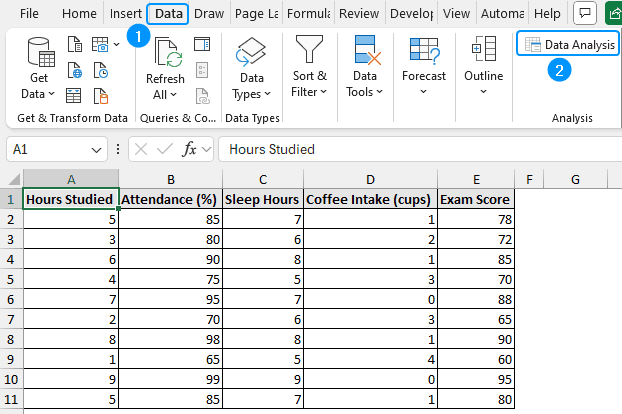
➤ Slope is the rate of change of the dependent variable relative to the independent variable. In this article, we’ll learn about uncertainty of slope and how to find the uncertainty of slope in Excel using the Data Analysis ToolPak add-in and the LINEST function. We’ll also discuss the key findings of our results and understand the significance of uncertainty of slope. Slope: Slope measures the rate of change of the dependent (y) variable for one unit change in the independent (x) variable. Uncertainty of slope: Uncertainty of slope indicates the degree of fluctuation in the calculated slope. This expected fluctuation is measured by the standard error of the slope, where a lower value indicates better confidence in the slope. The student exam scores dataset contains the hours studied, attendance (%), sleep hours, coffee intake (cups), and exam scores in columns A, B, C, D, and E. Considering the exam scores column as the dependent variable. The independent variables will be the studied hours, attendance (%), sleep hours, and coffee intake (cups). Based on this, we’ll perform multiple linear regression to calculate the slope and uncertainty for each independent variable. It is important to note that each independent variable will have a slope and an associated uncertainty. For example, the slope of the hours studied variable is 3.5 with an uncertainty of 0.5. This means that for every unit increase in the hours studied, the exam score increases by 3.5 points with a margin of error of 0.5 points. Steps: ➤ Click on the File tab. ➤ Select Options. You can also use the shortcut Alt+F+T to open Excel Options. ➤ Select Add-ins >> Choose Excel Add-ins from the dropdown >> Go. ➤ Check the Analysis ToolPak option >> OK. The Data Analysis ToolPak will be available in the Data tab whenever you open a new workbook. ➤ Go to the Data tab >> Click Data Analysis. ➤ Select Regression >> OK. ➤ Select the input Y range (E1:E11), input X range (A1:D11), and tick Labels. ➤ The coefficients for each independent variable represent the slope, while the standard error accounts for the associated uncertainty. ➤ The number of hours studied variable has a slope of 1.81 with an uncertainty of 0.55. This indicates that for every extra hour of study, the exam score increases by 1.81 points with an uncertainty of ±0.55. A quick way to find the uncertainty of slope in Excel is using the LINEST function. Normally, the LINEST function calculates the statistics for a line using least squares method and returns the slope, uncertainty, and other statistics. Syntax The syntax for the LINEST function is given below. ➤ known_ys – dependent variable Steps: ➤ Select the output cell (A13) and enter the formula. The LINEST function returns an array. ➤ The first row of the array contains the slopes of the independent variables and the intercept. Use the LINEST function: Press Ctrl + Shift + Enter . The first two values in the first column are the slope and its uncertainty. The first two values in the second column are the intercept and its uncertainty. Uncertainty: Select the Chart >> Click on Chart Elements (plus icon) >> Check Error Bars >> Choose an option (standard error, percentage, standard deviation). Double-click on the trendline >> In the Format Trendline pane, check Display Equation on Chart. The equation is shown as y=mx+c where m is the slope and c is the y intercept. In this tutorial, we’ve learned about the uncertainty of slope and how to find the uncertainty of slope using the Data Analysis ToolPak add-in and the LINEST function. Feel free to download the practice file and let us know your preferred method.
➤ Uncertainty of slope measures the precision of the slope.
➤ Enable Data Analysis: File >> Options >> Excel Add-ins >> Data Analysis.
➤ Get uncertainty of slope: Data tab >> Data Analysis >> Regression >> Input range >> Output range >> Uncertainty of slope.
➤ LINEST function: LINEST(known_ys, [known_xs], [const], [stats])
➤ For Excel 2019 or earlier versions use Ctrl + Shift + Enter to apply the formula.
➤ On Excel 365 or later versions just press Enter .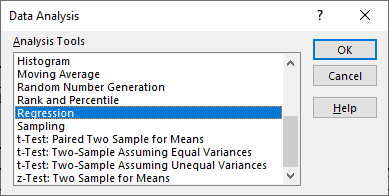
What is Uncertainty of Slope in Statistics?
Finding Uncertainty of Slope with Data Analysis ToolPak


➤ Choose the output cell (G1) >> OK.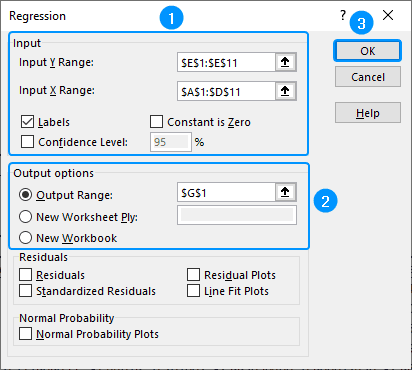
Variable Slope Uncertainty Hours Studied 1.810698285 0.548140896 Attendance (%) 0.363148844 0.164538796 Sleep Hours 1.038715663 0.517880747 Coffee Intake (cups) -1.038512015 0.717808095 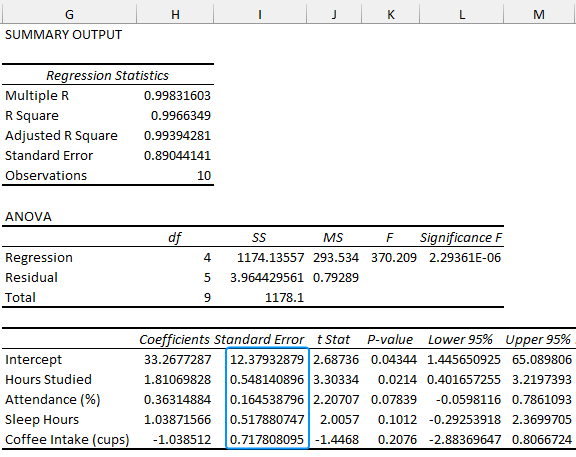
➤ Exam scores and study hours have a reliable relationship, as indicated by the comparatively low uncertainty relative to the slope.
➤ Exam scores have a strong association with other variables, like attendance (%) and sleep hours, as indicated by the positive slopes (0.36 and 1.04) and small uncertainty.
➤The negative slope of -1.04 for coffee intake indicates that higher coffee intake may be linked to worse exam scores. However, a high slope uncertainty indicates this result may not be statistically significant.
➤ All things considered, hours studied have a statistically significant positive effect on exam scores. Its slope is reasonably accurate, making it a reliable predictor.Using LINEST Function to Find Slope Uncertainty
=LINEST(known_ys, [known_xs], [const], [stats])
➤ [known_xs] – (Optional) independent variable
➤ [const] – (Optional) logical value. If TRUE constant is calculated normally; if FALSE constant is set to zero
➤ [stats] – (Optional) logical value. TRUE returns additional regression statistics; FALSE returns only coefficient.=LINEST(E2:E11,A2:D11,TRUE,TRUE)
➤ The second row contains the associated uncertainties of the independent variables and the intercept.
➤ The other values represent the R-squared, Residual standard error, F value, etc.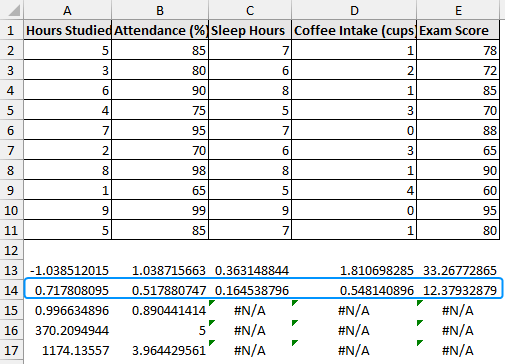
FAQ
How to find slope and intercept uncertainty in Excel?
=LINEST(known_ys, [known_xs], [const], [stats])How do you find uncertainty in Excel?
=CONFIDENCE.NORM(alpha,standard_dev,size)How to show uncertainty in an Excel graph?
How do I find the slope of my trendline in Excel?
Wrapping Up