Trying to calculate an intermediate value between known data points on a two dimensional grid? You’ll need to perform bilinear interpolation. In this article, you will learn about bilinear interpolation and explore how to perform bilinear interpolation in Excel. Whether you’re working with scientific observations, geographic data, or simulation results, bilinear interpolation will help you estimate accurate intermediate values from the grid. By the end, you can confidently use bilinear interpolation on your own two dimensional grid.
➤ Bilinear interpolation estimates a value based on known values of x and y in a grid. In this article, we’ll learn about bilinear interpolation and use the bilinear interpolation Excel formula. The estimation of pressure over a two dimensional surface between the distance from center and altitude will be used to demonstrate bilinear interpolation in Excel.
➤ Bilinear interpolation accounts for both the horizontal and vertical axes, thus improving accuracy over linear interpolation.
➤ Set up your dataset >> look up the surrounding values using INDEX and MATCH >> use bilinear interpolation formula.
➤ x1: =INDEX(x_values,MATCH(x,x_values,1))
➤ x2: =INDEX(x_values,MATCH(x,x_values,1)+1)
➤ y1: =INDEX(y_values,MATCH(y,y_values,1))
➤ y2: =INDEX(y_values,MATCH(y,y_values,1)+1)
➤ F11: =INDEX(pressure_values,MATCH(y1,y_values,0),MATCH(x1,x_values,0))
➤ F12: =INDEX(pressure_values,MATCH(y2,y_values,0),MATCH(x1,x_values,0))
➤ F21: =INDEX(pressure_values,MATCH(y1,y_values,0),MATCH(x2,x_values,0))
➤ F22: =INDEX(pressure_values,MATCH(y2,y_values,0),MATCH(x2,x_values,0))
➤ Bilinear interpolation formula: =1/((x2-x1)*(y2-y1))*(F11*(x2-x)*(y2-y)+F21*(x-x1)*(y2-y)+F12*(x2-x)*(y-y1)+F22*(x-x1)*(y-y1))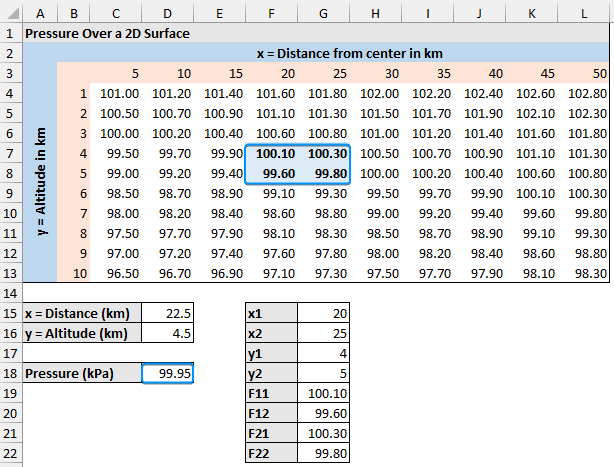
What Bilinear Interpolation in Statistics?
Bilinear interpolation estimates a value at a given point within a two dimensional grid based on the known values of x (horizontal) and y (vertical). It extends linear interpolation into two dimensions, which improves its accuracy over basic linear interpolation.
The formula for bilinear interpolation:
![]()
Performing Bilinear Interpolation in Excel
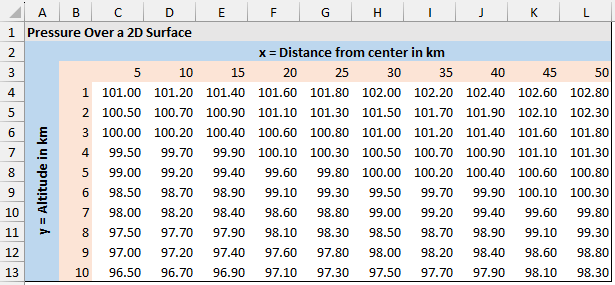
Consider the pressure readings over a two dimensional surface dataset.
➤ The columns (x axis) represent the distance from the center in kilometers.
➤ The rows (y axis) represent the altitude in kilometers.
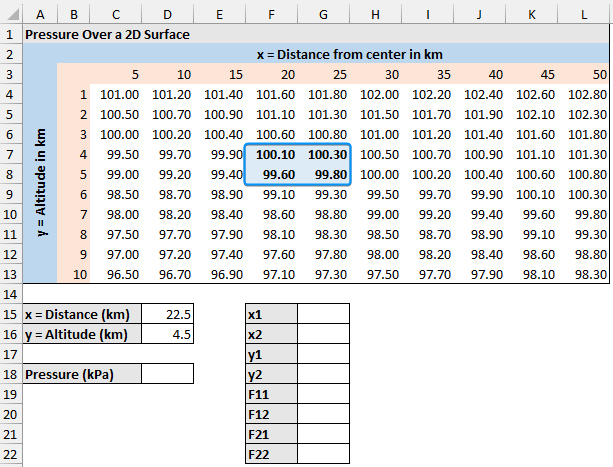
We want to estimate the pressure for an x value of 22.5 km and a y value of 4.5 km. The pressure value will lie somewhere between the surrounding values.
➤ F11: (20, 4) = 100.10
➤ F12: (20, 5) = 99.60
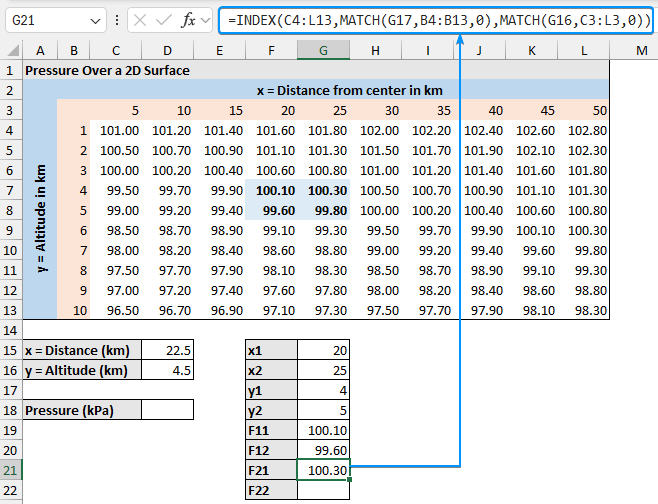
➤ F21: (25, 4) = 100.30
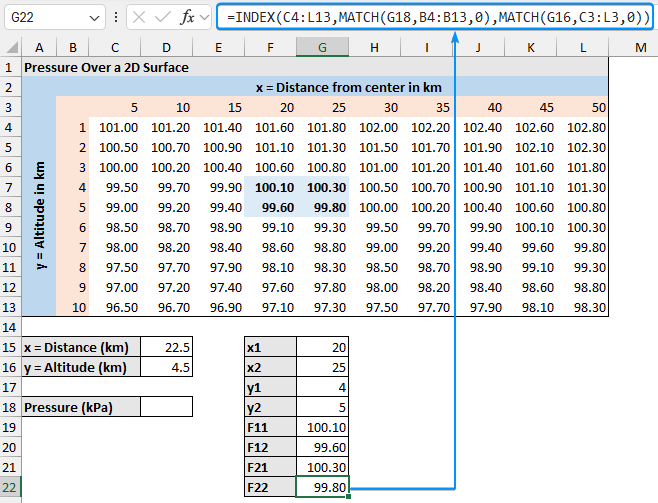
➤ F22: (25, 5) = 99.80
We’ll use Excel’s INDEX and MATCH functions to extract the surrounding values before performing the bilinear interpolation. This method is well-suited for a structured grid format, allowing for a quick estimate at any point in the grid. The use of INDEX and MATCH functions to look up values from the grid is compatible with all versions of Excel. If you’re using a newer version of Excel, you may use the VLOOKUP or XLOOKUP functions instead.
Steps:
➤ Select the output cell (G15) and enter the formula. This returns the x1 value which is the distance from the center.
=INDEX(C3:L3,MATCH(D15,C3:L3,1))

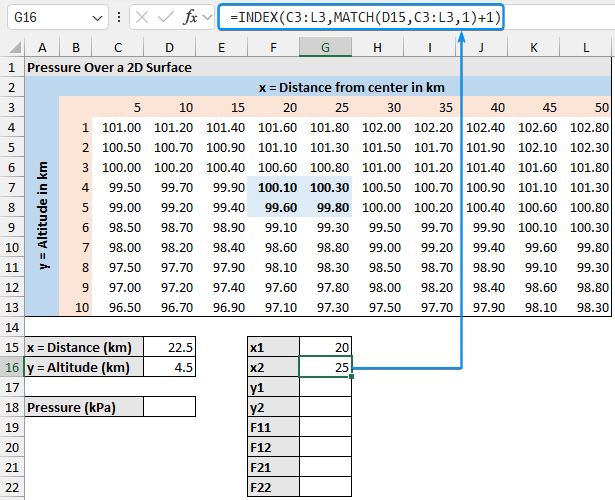
➤ Similarly, get the x2 value by adding one to the MATCH function result.
=INDEX(C3:L3,MATCH(D15,C3:L3,1)+1)
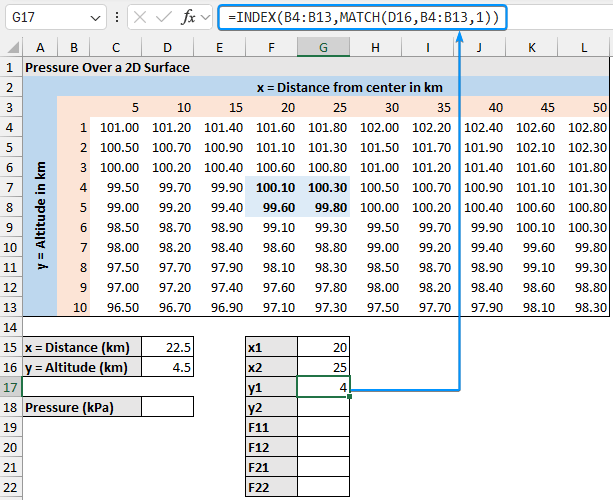
➤ The y1 value represents the altitude.
=INDEX(B4:B13,MATCH(D16,B4:B13,1))
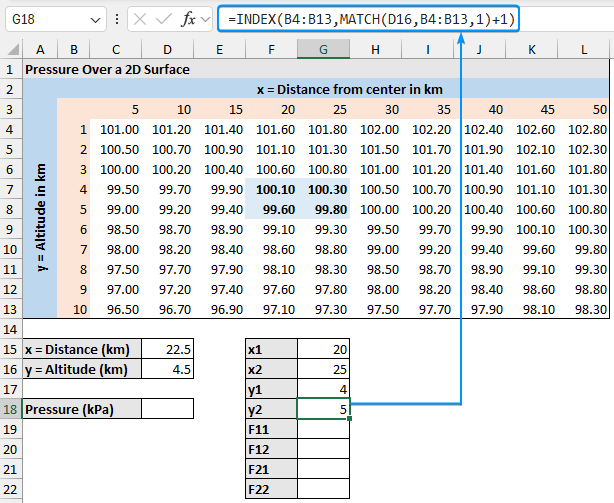
➤ The y2 value.
=INDEX(B4:B13,MATCH(D16,B4:B13,1)+1)
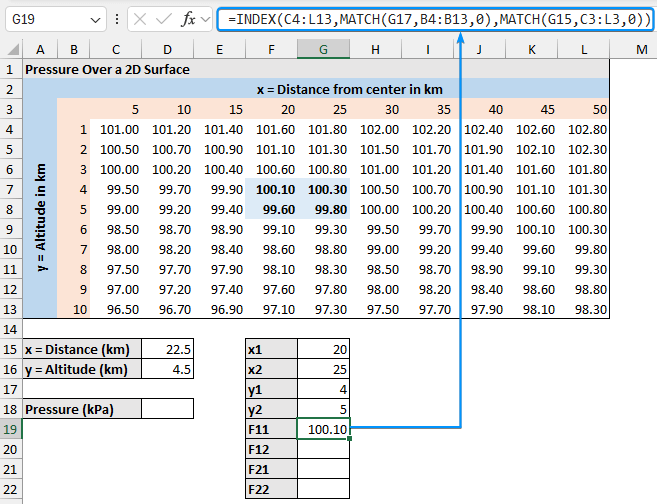
➤ The F11 value is the pressure corresponding to the x1 and y1 values. In this case, F11 is 100.10 kPa (At the intersection of 20km distance from the center and 4km altitude).
=INDEX(C4:L13,MATCH(G17,B4:B13,0),MATCH(G15,C3:L3,0))
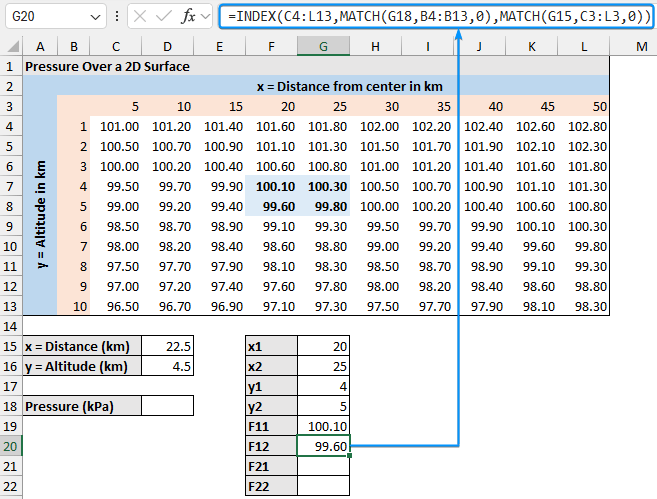
➤ Similarly, F12 is the pressure corresponding to x1 and y2.
=INDEX(C4:L13,MATCH(G18,B4:B13,0),MATCH(G15,C3:L3,0))
➤ The F21 pressure value for x2 and y1.
=INDEX(C4:L13,MATCH(G17,B4:B13,0),MATCH(G16,C3:L3,0))
➤ Lastly, the F22 is the pressure for x2 and y2.
=INDEX(C4:L13,MATCH(G18,B4:B13,0),MATCH(G16,C3:L3,0))
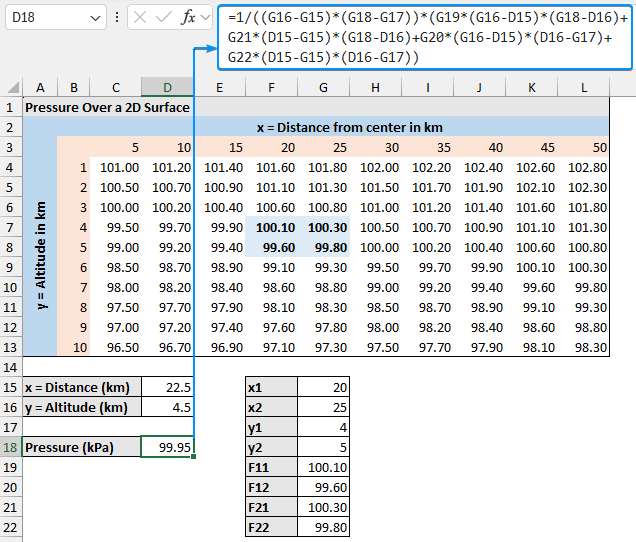
➤ Use the formula for bilinear interpolation.
=1/((G16-G15)*(G18-G17))*(G19*(G16-D15)*(G18-D16)+G21*(D15-G15)*(G18-D16)+G20*(G16-D15)*(D16-G17)+G22*(D15-G15)*(D16-G17))
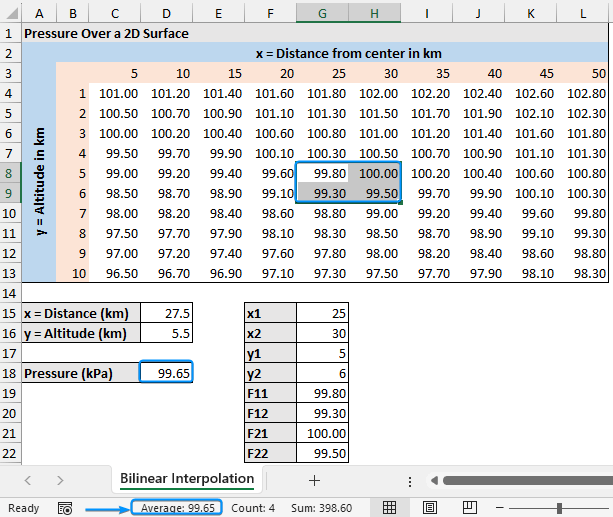
Calculation Validation (Optional)
➤ Since this is a complex formula, we need to validate the results. Enter a different value of x (27.5) and y (5.5). The result should match the average shown in the status bar.
➤ Using the bilinear interpolation Excel formula, the estimated pressure at an x value of 22.5 km and a y value of 4.5 km is 99.95 kPa.
FAQ
What is bilinear interpolation?
Bilinear interpolation estimates a value at a given point within a grid based on the known values of x (horizontal) and y (vertical).
How does bilinear interpolation differ from linear interpolation?
Linear interpolation estimates a value along a single axis (one dimension). In contrast, bilinear interpolation works in two dimensions and requires four surrounding points along the x and y axes.
What are some real-world applications of bilinear interpolation?
Bilinear interpolation is used in:
➤ Geographic Information Systems (GIS) for interpolating terrain elevation.
➤ Image processing for resizing images.
➤ Computer graphics for texture mapping.
What if my interpolation point is not exactly centered?
Even if a point is off center, the bilinear formula accounts for any value surrounded by four values within the rectangular grid.
How do you perform nonlinear interpolation in Excel?
Use the GROWTH function: =GROWTH(known_ys,[known_xs],[new_xs],[const])
Or
Insert Chart >> Chart Elements >> Trendline >> More Options >> Display equation >> Plug in x value.
Wrapping Up
In this tutorial, we’ve learned about bilinear interpolation and how to perform bilinear interpolation using Excel. Lastly, we’ll explain the results of our example. Feel free to download the practice file and share your thoughts and suggestions.