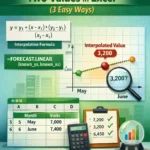
In the real world, relationships are not always linear. For instance, treasury yields, the spread of infectious disease, etc., often exhibit a non linear trend. This article explores non linear interpolation and will teach you two ways how to perform non linear interpolation in Excel. Whether you are working in scientific research, engineering, or finance, becoming skilled in this area will help you create more precise and reliable forecasts and assessments.
➤ Non linear interpolation is an estimation between two known data points for a non linear relationship. In this article, we’ll learn about non linear interpolation and two ways to perform non linear interpolation in Excel using the GROWTH function and the Trendline feature.
➤ Function: =GROWTH(known_ys,[known_xs],[new_xs],[const])
➤ Trendline: Insert Chart >> Chart Elements >> Trendline >> More Options >> Display equation >> Plug in x value.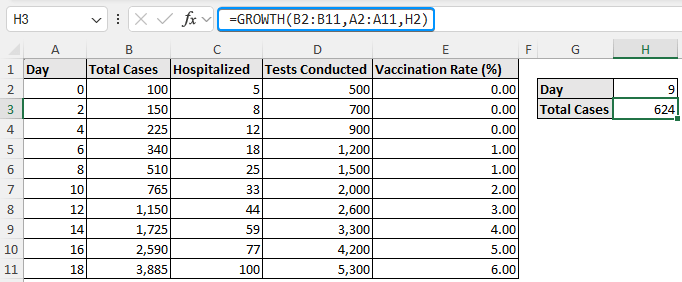
Non linear Interpolation
Non linear interpolation estimates the values between two or more known data points when the relationship shows a non linear trend. Non linear interpolation accounts for varying rates, such as exponential growth, polynomial curves, or logarithmic patterns, in contrast to linear interpolation, which assumes a constant rate of change.
Using GROWTH Function to do Non linear Interpolation in Excel
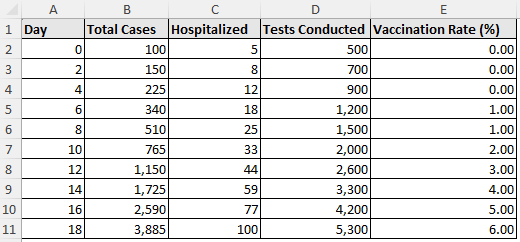
The COVID-19 spread dataset contains the day, total cases, hospitalized, tests conducted, and vaccination rate (%) from columns A through E.
Suppose you want to calculate the total number of cases recorded on day 9. Excel’s GROWTH function estimates intermediate values by fitting an exponential curve through the known data points. It is well suited for data that grows quickly and non linearly, like in compound interest, population expansion, or epidemiology.
Steps:
➤ Enter the day for which you want to interpolate, in our case, day 9.
➤ Select the output cell (H3) and enter the GROWTH function.
=GROWTH(B2:B11,A2:A11,H2)
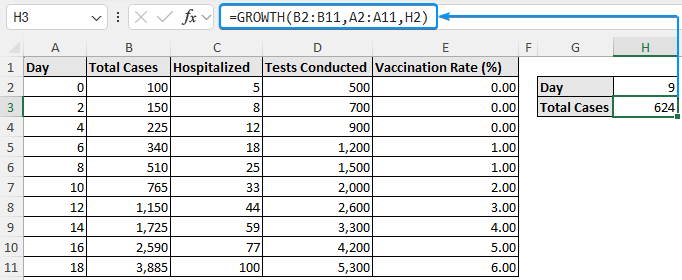
Based on our interpolation results, the total number of cases on day 9 is 624.
Performing Non linear Interpolation in Excel with Trendline
The treasury yield dataset shows the treasury yield percentage for various maturities.
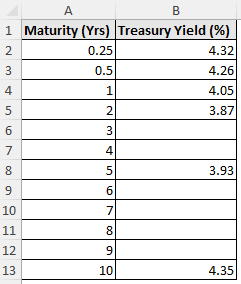
The catch here is that the treasury yield percentage is given for maturities of 3 months (0.25 years), 6 months (0.5 years), 12 months (1 year), 2 years, 5 years, and 10 years. To calculate an intermediate treasury yield percentage, say 4 years maturity, we must perform interpolation.
Let’s use Excel’s Trendline feature to fit a polynomial curve. Then we can plug the intermediate maturity value into the equation to calculate the treasury yield percentage.
Polynomial Trendlines can identify turning points and curvature in financial and economic data and are suitable for interpolating numbers along a curved pattern.
Steps:
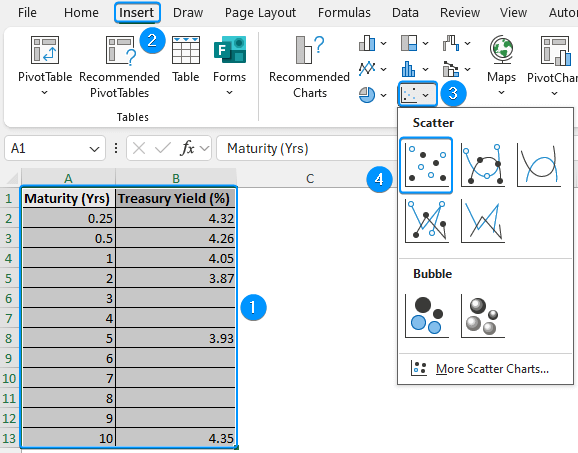
➤ Select the dataset (A1:B13) >> Insert >> Scatter or Bubble >> Scatter.
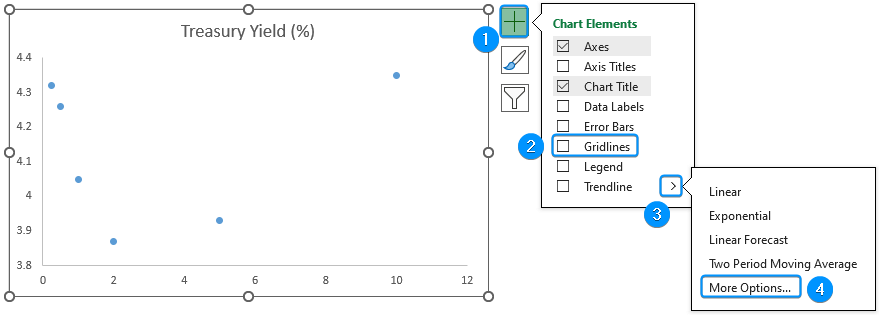
➤ Go to Chart Elements >> Uncheck Gridlines >> Click the arrow beside Trendline >> Choose More Options.
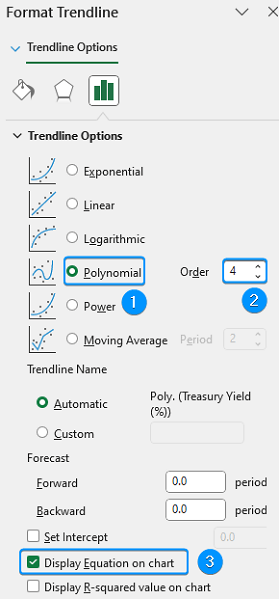
➤ Several Trendline options are available. Choose the options that best fit the data points.
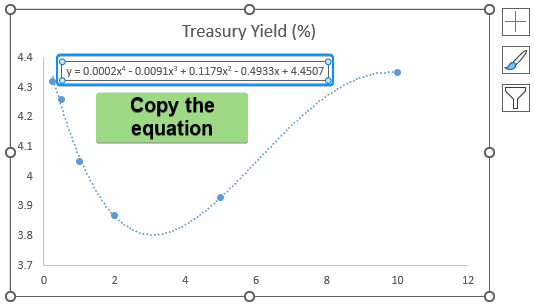
➤ We’ve chosen the Polynomial option with Order 4. Feel free to try out other options that best fit the trend.
➤ Enable the option Display equation on chart.
➤ Select the equation and press Ctrl + C to copy it.
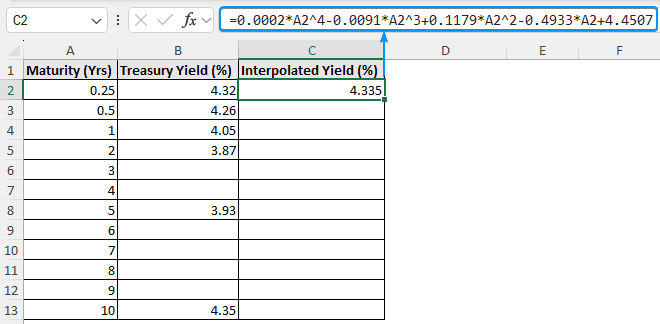
➤ Paste the equation in cell C2 >> Plug in the x value (maturity). For example, replace the x values with a cell reference A2 containing maturity 0.25 years.
=0.0002*A2^4-0.0091*A2^3+0.1179*A2^2-0.4933*A2+4.4507
➤ Use the Fill Handle tool to copy the formula to the cells below.
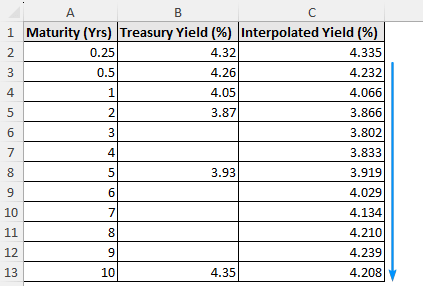
➤ The Polynomial Trendline fits non linear curves and displays the equation. By plugging intermediate maturities into the equation, the treasury yield percent can be calculated. For instance, the interpolated treasury yield is 3.83% for 4 year maturity.
FAQ
How do you perform non linear interpolation in Excel?
Use the GROWTH function:
=GROWTH(known_ys,[known_xs],[new_xs],[const])
What is the non linear interpolation method?
Non linear interpolation considers the curvature of the data to estimate the values between two known data points. This makes it suitable for curved patterns. There are several non linear methods like logarithmic, polynomial, exponential, etc.
Is there a linear interpolation function in Excel?
Use the FORECAST or FORECAST.LINEAR function:
=FORECAST(x,known_ys,known_xs)
Or, =FORECAST.LINEAR(x,known_ys,known_xs)
What does R squared represent in polynomial interpolation?
It displays the degree to which the curve matches the data. A value nearer 1 is preferable.
Can we forecast beyond the dataset with interpolation?
The forecasting will not be consistent since interpolation estimates from known data. To forecast outside the data range, time series tools or regression models are better suited.
Wrapping Up
In this tutorial, we’ve learned about non linear interpolation how to perform non linear interpolation in Excel with the GROWTH function and the Trendline feature. Feel free to download the practice file and share your thoughts and suggestions.