The normal distribution is a bell shaped curve that is symmetrical about the mean. You can use functions to calculate normal distribution probability in Excel.
➤ Normal distribution is a continuous probability distribution symmetrical about the mean.
➤ The area under the normal distribution curve equals one.
➤ Probability less than a value: =NORM.DIST(x,mean,standard_dev,TRUE)
➤ Probability greater than a value: =1-NORM.DIST(x,mean,standard_dev,TRUE)
➤ Probability between two values (x1 < Pr < x2): =NORM.DIST(x2,mean,standard_dev,TRUE) - NORM.DIST(x1,mean,standard_dev,TRUE)
➤ Probability exactly equal to a value: =NORM.DIST(x,mean,standard_dev,FALSE)
➤ Use the PDF argument when calculating an exact value and use CDF for less than, greater than, or between two values.
In this article, we’ll learn to calculate normal distribution probability in Excel for less than a value, greater than a value, between two values, and exactly equal to a value. We’ll use the NORM.DIST function.
What is Normal Distribution?
The normal distribution is a continuous probability distribution that is symmetrical about the mean and follows a bell-shaped curve. The total area under the normal distribution curve represents the probability of all possible outcomes and equals one.
Overview of NORM.DIST Function in Excel
The NORM.DIST or NORMDIST function returns the normal distribution for the specified mean and standard deviation.
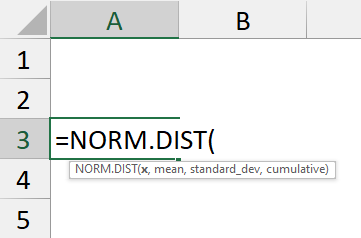
Syntax
The syntax for the NORM.DIST function is given below. It takes 4 mandatory arguments.
=NORM.DIST(x,mean,standard_dev,cumulative)
➤ x argument: Value at which to evaluate the function.
➤ mean: Mean of ln(x).
➤ standard_dev: Standard deviation of ln(x).
➤ cumulative: Logical value, where TRUE returns cumulative distribution function and FALSE returns probability density function.
Calculating Probability Less than a Value
In this dataset, we have the monthly electricity usage (in kWh) for 10 households. Assuming this data is normally distributed, let’s find the probability that a randomly selected household’s electricity usage is less than 390kWh.
Steps:
➤ Calculate the sample mean using the AVERAGE function.
=AVERAGE(B2:B11)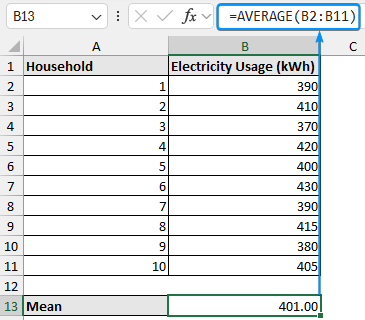
➤ Get the sample standard deviation using the STDEV.S or STDEV function.
=STDEV.S(B2:B11)
➤ Use the NORM.DIST function in the B16 cell.
=NORM.DIST(390,B13,B14,TRUE)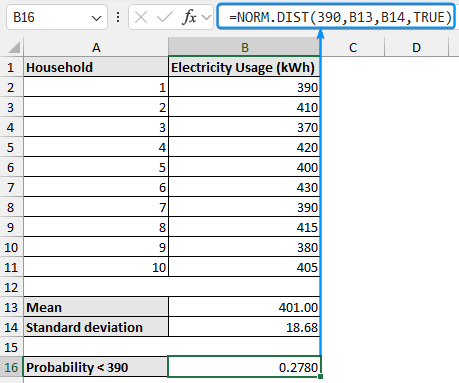
The probability that a randomly selected household’s electricity usage is less than 390kWh is 0.2780 or 27.80%.
Calculating Probability Greater than a Value
Using the same dataset, let’s calculate the probability that a randomly selected household’s electricity usage is greater than 390kWh.
➤ Select the output cell B17 and enter the formula.
=1-NORM.DIST(390,B13,B14,TRUE)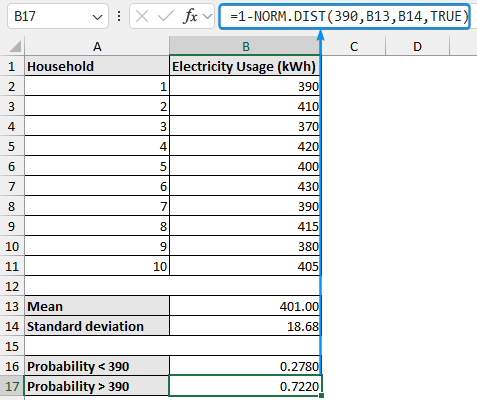
The probability that a randomly selected household’s electricity usage is greater than 390kWh is 0.7220 or 72.20%.
Calculating Probability Between Two Values
Let’s find the probability that a randomly selected household’s electricity usage is between 380 and 410 kWh.
➤ Enter this formula in the B18 cell.
=NORM.DIST(410,B13,B14,TRUE)-NORM.DIST(380,B13,B14,TRUE)
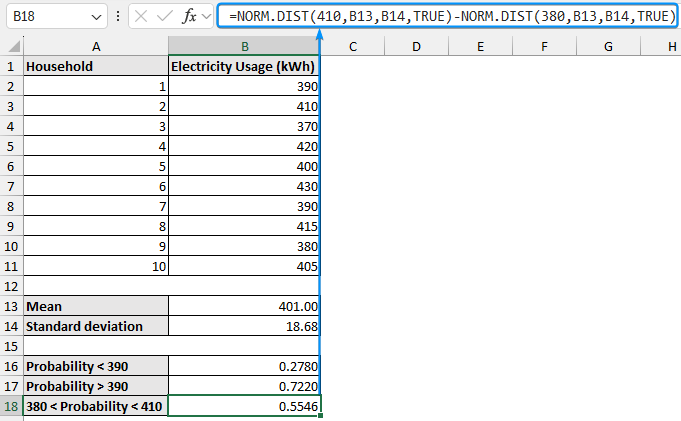
The probability that a randomly selected household’s electricity usage is between 380 and 410 kWh is 0.5546 or 55.46%.
Calculating Probability Exactly Equal to a Value
Finally, let’s find the probability that a randomly selected household’s electricity usage is exactly 400 kWh. We need to use the probability density function argument in the formula.
➤ Select the cell (B19) and enter this formula.
=NORM.DIST(400,B13,B14,FALSE)
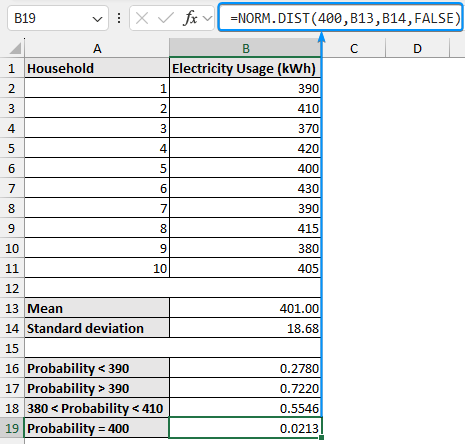
The probability that a randomly selected household’s electricity usage is exactly 400 kWh is 0.0213 or 2.13%.
Notes:
➤ If the mean or standard deviation is non-numeric the NORM.DIST function returns #VALUE! error.
➤ If the standard deviation is less than or equal to zero the function returns #NUM! error.
FAQ
What is the NORM.DIST function in Excel?
Returns the normal distribution for the specified mean and standard deviation.
=NORM.DIST(x,mean,standard_dev,cumulative)
How to check if the data is normally distributed in Excel?
Plot a histogram with the data points and inspect its shape. The shape is unlikely to be smooth but if the peak is in the middle and the plot is fairly symmetrical, then the data can be assumed to be normally distributed.
What is the difference between the cumulative and density functions in NORM.DIST?
The cumulative function returns the probability that a value is less than or equal to a given value. On the other hand, the density function returns the probability that the random variable will take a particular value.
What does the NORM.INV function do?
Returns the inverse of the normal cumulative distribution for the specified mean and standard deviation. It’s used to calculate the value corresponding to a given probability.
=NORM.INV(probability,mean,standard_dev)
What is the difference between NORM.DIST and NORM.S.DIST?
The NORM.DIST function lets you specify any mean and standard deviation. In contrast, the NORM.S.DIST function represents the standard normal distribution with a mean of 0 and a standard deviation of 1.
Wrapping Up
In this tutorial, we’ve learned about the normal distribution probability in Excel through four examples. Feel free to download the practice file and share your thoughts and suggestions.