Variance indicates how much the values in a dataset deviate from the mean (average). You can use built-in Excel functions to calculate the variance.
➤ Variance measures the degree to which the observations vary from the average.
➤ Population represents the entire dataset while a sample is a subset of the population.
➤ Generally, we calculate the sample variance to estimate the population variance.
➤ Sample variance function: =VAR.S(number1, [number2])
➤ Population variance function: =VAR.P(number1, [number2])
➤ For text or logical values use: =VARA(number1, [number2])
In this article, we’ll learn about the variance, the difference between population and sample variances, and different Excel functions to calculate the variance.
What is Variance in Statistics?
Variance represents the degree of spread or dispersion, indicating how much the values in a dataset deviate from the mean (average). Mathematically, variance is the square of the standard deviation.
Population and Sample Variance
Population refers to every observation in the dataset, whereas sample denotes a subset of that population.
Overview: VAR.S Function in Excel
The VAR.S or the VAR function estimates the variance of a sample, ignoring any logical or text values in the sample.
Syntax
The syntax for the VAR.S function is given below.
=VAR.S(number1, [number2])
➤ number1: represents a sample of a population.
➤ number2: (Optional)
The syntaxes for the other variance functions (VAR.P, VARA, VARPA) are similar.
Different Variance Functions
| Functions | Population | Sample | Logical values and text |
|---|---|---|---|
| VAR.S or VAR | ✓ | ❌ | |
| VAR.P or VARP | ✓ | ❌ | |
| VARA | ✓ | ✓ | |
| VARPA | ✓ | ✓ |
Calculating Variance of Numeric Values
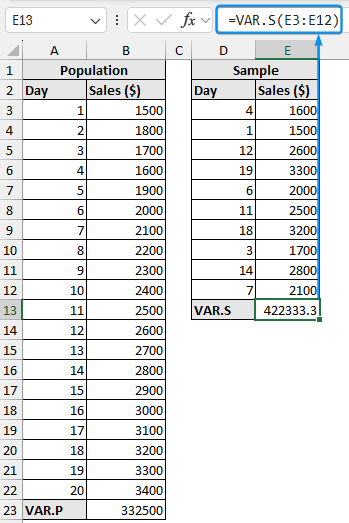
Consider the daily sales figures for a small retail business over 20 days. Assuming this is the entire population we’ll calculate the variance.
➤ Use the VAR.P function to calculate the population variance in the output cell (B32).
=VAR.P(B3:B22)
➤ The data below shows a sample of 10 randomly selected observations from the population. Let’s calculate the sample variance using the VAR.S or VAR function.
=VAR.S(E3:E12)
Calculating Variance of Logical Values and Text
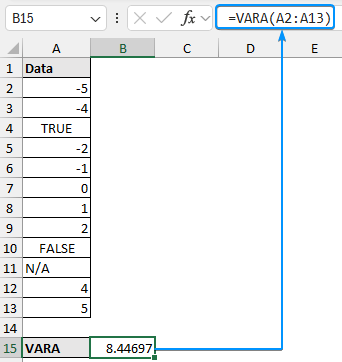
For datasets containing logical values (TRUE/FALSE) or text, we can use the VARA or the VARPA function for the sample or population variance. Any text or logical value FALSE is considered zero (0) while the logical value TRUE is converted to one (1).
➤ Select cell B15 and apply the VARA function to calculate the sample variance.
=VARA(A2:A13)
Likewise, you can use the VARPA function to calculate the population variance of a dataset containing logical and text values.
➤ VAR.S calculates the sample variance, whereas VAR.P calculates the population variance.
➤ The arguments of VAR.S and VAR.P have to be numerical values, any blank cells, logical values, and text are ignored.
➤ To calculate text representation of numeric data or logical values use the VARA or the VARPA function.
➤ The VARA or VARPA function converts the logical value TRUE to 1 and text or FALSE to 0.
FAQ
How to calculate variance and standard deviation using Excel?
Sample variance: =VAR.S(number1, [number2])
Population variance: =VAR.P(number1, [number2])
Sample standard deviation: =STDEV.S(number1, [number2])
Population standard deviation: =STDEV.P(number1, [number2])
How to calculate the percentage of variance?
Percentage of variance =[(new value - old value) / old value]*100%
What is the difference between variance and standard deviation?
Standard deviation indicates how far apart the observations lie in a dataset. In contrast, variance measures the extent to which the observations vary from the average.
What is the difference between VAR.P and VAR.S in Excel?
The P stands for population. Use the VAR.P or VARP if the dataset represents the entire population. The S stands for sample. If the data is a subset of the population use the VAR.S or VAR function.
Can I calculate the variance for logical values and text in Excel?
Variance is calculated for numeric data. For logical values (TRUE/FALSE) you can use the VARA function which considers TRUE as 1 and FALSE as 0. You need to convert texts to a suitable numeric scale.
How do I handle missing or empty cells in my data range?
The variance functions automatically ignore empty cells, missing data won’t affect the calculation.
Wrapping Up
In this article, we’ve learned about variance, different variance functions in Excel, and how to calculate the variance. Feel free to download the practice file and share your thoughts and suggestions.