Venn diagrams are perfect for visually showing overlaps, shared traits, and differences between datasets or categories. While Excel doesn’t offer a built-in Venn diagram feature, you can still create them manually with a few clever tricks using SmartArt or shapes.
In this article, you’ll learn how to make a Venn diagram in Excel using multiple methods starting from SmartArt graphics to fully customized circle shapes with text and transparency. These methods work across Excel 2013, 2016, 2019, 2021, and Microsoft Office 365.
Steps to make a Venn diagram in Excel:
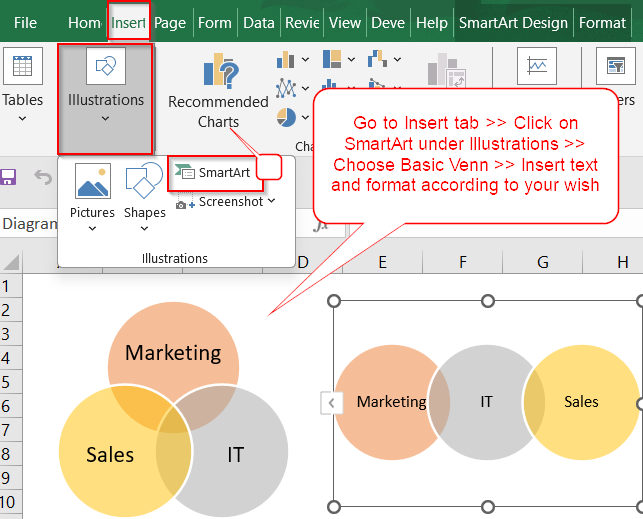
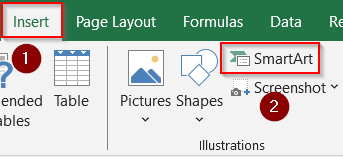
➤ Go to the Insert tab, click SmartArt under the Illustrations group.
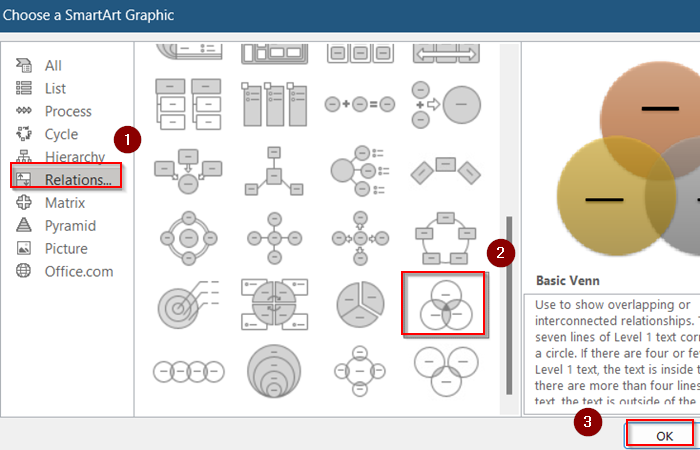
➤ Select Relationship from the left panel.
➤ Choose Basic Venn and click OK to insert it into your sheet.
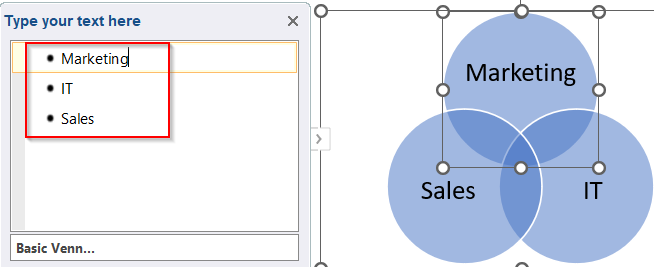
➤ A default Venn diagram with three overlapping circles will appear.
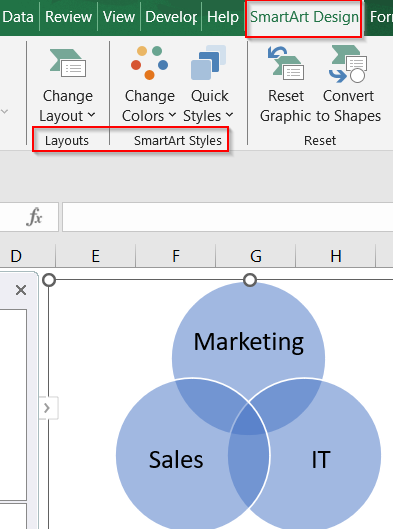
➤ Click on each circle to type in labels (e.g., “Marketing,” “Sales,” “IT”).
➤ You can also use the Text Pane to edit circle names and adjust order.
➤ To customize, go to the SmartArt Design tab where you can change colors, apply 3D effects and add shapes for more categories using Layout and SmartArt Styles on the ribbon.
Insert a Venn Diagram Using SmartArt Feature
This is the fastest and easiest way to create a basic Venn diagram. It’s ideal for presentations, teaching, or comparing simple categories.
Steps:
➤ Go to the Insert tab, click SmartArt under the Illustrations group.
➤ Select Relationship from the left panel.
➤ Choose Basic Venn and click OK to insert it into your sheet.
➤ A default Venn diagram with three overlapping circles will appear.
➤ Click on each circle to type in labels (e.g., “Marketing,” “Sales,” “IT”).
➤ You can also use the Text Pane to edit circle names and adjust order.
➤ To customize, go to the SmartArt Design tab where you can change colors, apply 3D effects and add shapes for more categories using Layout and SmartArt Styles on the ribbon.
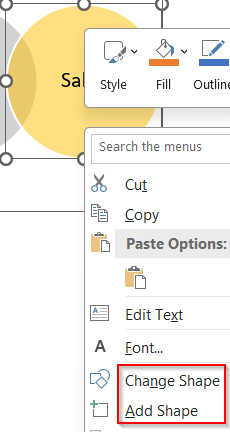
➤ You can also right-click any circle to change it’s shape and add new shapes to your Venn diagram easily.
Note: SmartArt Venn diagrams are best for visual explanation but they don’t represent real data or numbers based directly on the dataset.
Create a Custom Venn Diagram Using Shapes Tool
If you want full control over how your Venn diagram looks including sizes, transparency, and overlapping zones, use Excel’s Shape tools.
Steps:
➤ Go to Insert >> Shapes and select the Oval shape.
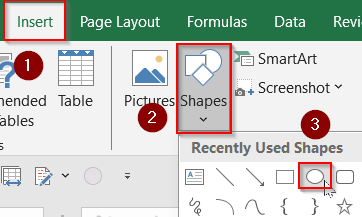
➤ Hold Shift while dragging to draw a perfect circle.
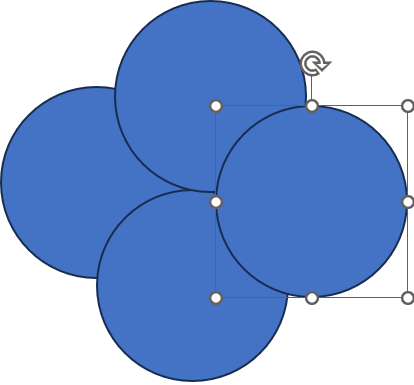
➤ Copy using Ctrl + C and paste using Ctrl + V the circle to create a second one, then drag it to partially overlap the first. Add as many circles you want.
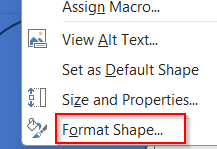
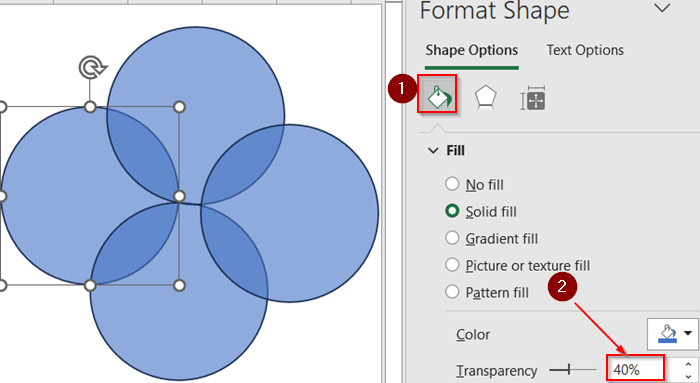
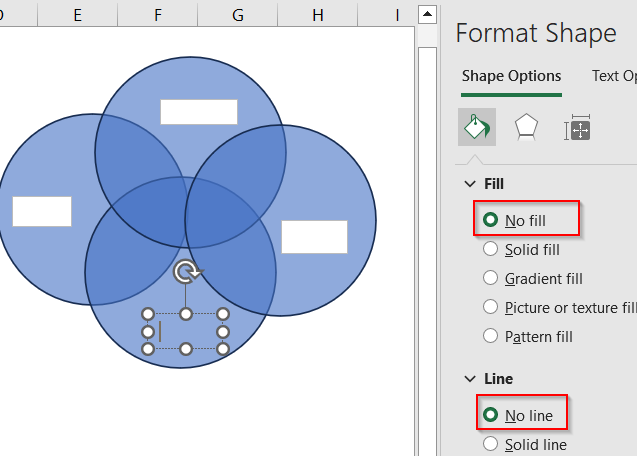
➤ To show intersection clearly, right-click each circle >> Choose Format Shape.
Under Fill, select a color and reduce Transparency to around 30–40%.
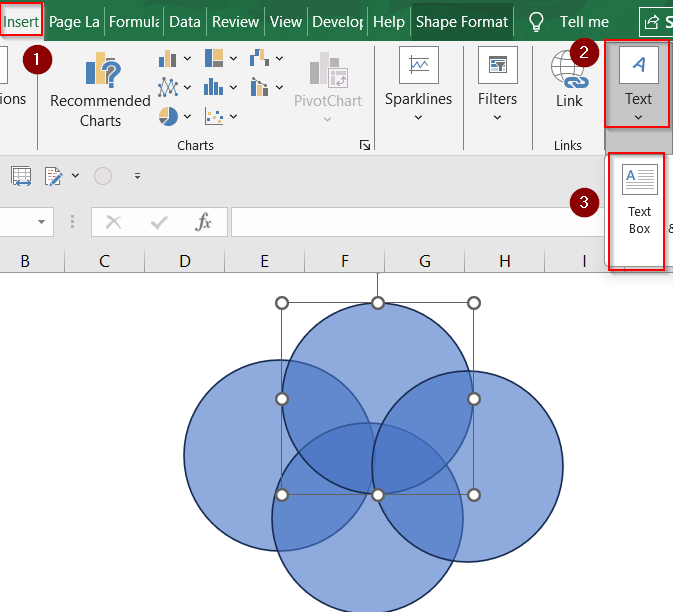
➤ Add text boxes inside each circle using Insert tab >> Text Box under Text group and overlap region to label each section (e.g., “A,” “B,” “A + B”).
➤ Change the Fill color to No fill and Line options to No line for each textbox from Format Shape.
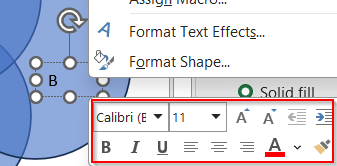
➤Right-click to change your font style, size and text alignment.
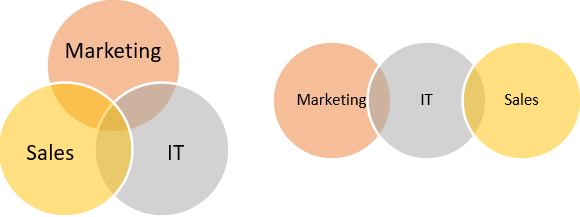
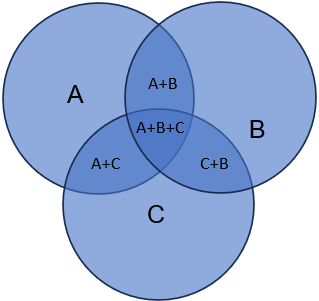
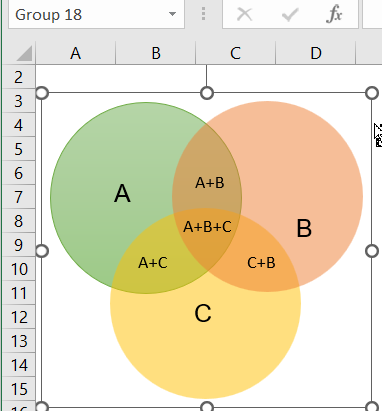
➤ When you’re done inserting information and editing your custom Venn diagram, it should look like this.
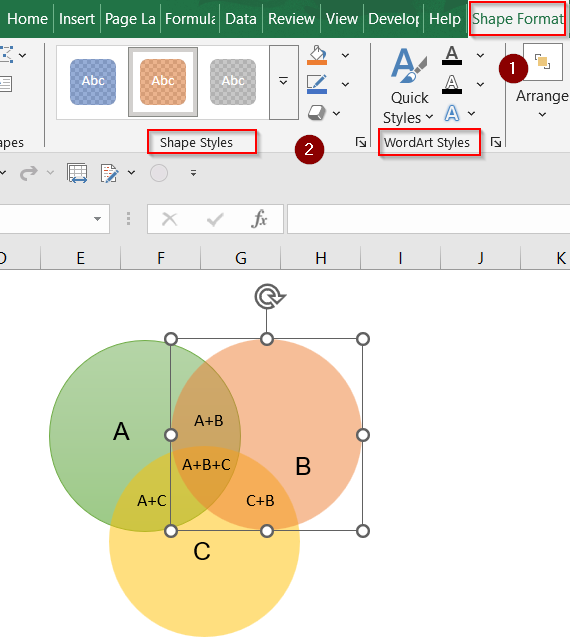
➤ Using the Shape Format tab, you can assign different colors to each circle from Shape Styles and also format your text accordingly using WordArt Styles on the ribbon.
➤ Select all boxes using the Shift key and right-click to Group them together.
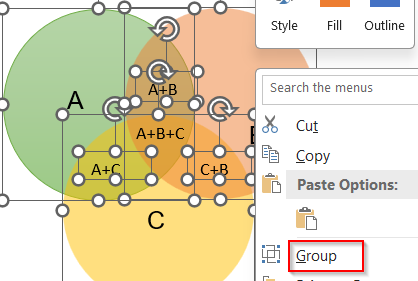
➤ Now you can move the Venn diagram easily as one single element.
This method gives you maximum design freedom and works even for non-standard Venn diagrams.
Frequently Asked Questions
Does Excel have a built-in Venn diagram chart?
No, Excel doesn’t offer a dedicated Venn diagram chart type. You can create one manually using SmartArt graphics or overlapping shape tools for basic visual comparisons.
Can I make a data-driven Venn diagram in Excel?
Not directly. Excel doesn’t support true data-driven Venn diagrams, but you can simulate one by overlaying data values on shapes or using third-party charting add-ins.
Is it possible to adjust circle transparency in SmartArt?
No, SmartArt Venn diagrams don’t allow transparency adjustments. Use manually drawn shapes instead, where you can control fill color, transparency, and overlapping for better clarity.
Can I make a 4-set or 5-set Venn diagram in Excel?
Yes, but it’s fully manual. You’ll need to insert and carefully arrange additional circles. Excel SmartArt only supports up to three overlapping sets by default.
Wrapping Up
In this tutorial, we learned how to make a Venn diagram in Excel using SmartArt and custom shapes. While Excel doesn’t support true Venn charts, these workarounds give you the freedom to create insightful visuals that help communicate shared traits, differences, and overlaps. Feel free to download the practice file and share your feedback.