Printing Avery labels directly from Excel is a convenient way to create professional mailing lists, product tags, or address labels. However, Excel alone doesn’t provide label templates and it’s best ...
In Excel, there are many cases where you only need a portion of the text in a cell, for example, extracting product codes, employee IDs, or abbreviations. Instead of manually typing or trimming data, ...
Working with dates in Excel often requires extracting specific components, such as the month, for reporting, analysis, or data visualization. Knowing how to pull the month from a date can save time ...
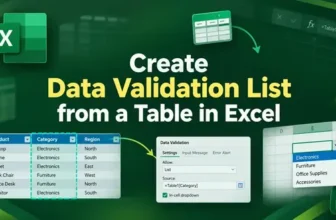
Creating a data validation list from a table in Excel helps you build drop-down menus that expand automatically when new items are added. Unlike static lists, a table-based validation list stays ...
Ensuring data accuracy in Excel is crucial when working with large datasets or reports. Sometimes, a single validation rule isn’t enough and you might want to check for multiple conditions at once, ...
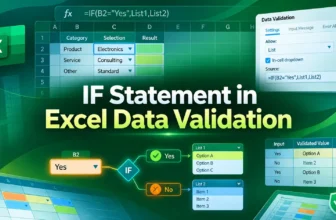
Data validation in Excel is an effective feature that lets you control what users can enter into a cell. By using an IF statement in data validation, you can create conditional rules that adapt based ...
Searching for data in Excel often requires finding matches that aren’t exact. Standard lookup functions may fail when text has extra words, prefixes, or suffixes. Partial matches become essential in ...
The SUMIF function in Excel is an effective way to total values that meet specific conditions. But if you only want to match part of the text like entries that contain, start with, or end with a ...