Linear extrapolation is useful for estimating future values based on historical trends, whether you’re analyzing business indicators or projecting future growth. From using simple formulas to charting tools, this blog explores five ways to linear extrapolation in Excel.
➤ Extrapolation predicts values outside known data points, given that the trend continues. In this article, you’ll learn five ways to perform linear extrapolation in Excel using arithmetic formula, LINEST, TREND, FORECAST.LINEAR functions and using the Trendline feature.
➤ Arithmetic formula: y = y1 + (x - x1) * (y2 - y1) / (x2 - x1)
➤ LINEST: =LINEST(known_ys,[known_xs])
➤ TREND: =TREND(known_ys,[known_xs],[new_xs])
➤ FORECAST.LINEAR: =FORECAST.LINEAR(x,known_ys,known_xs)
➤ Trendline: Insert Chart >> Chart Elements >> Trendline >> More Options >> Linear trendline >> Display equation >> Plug in x value.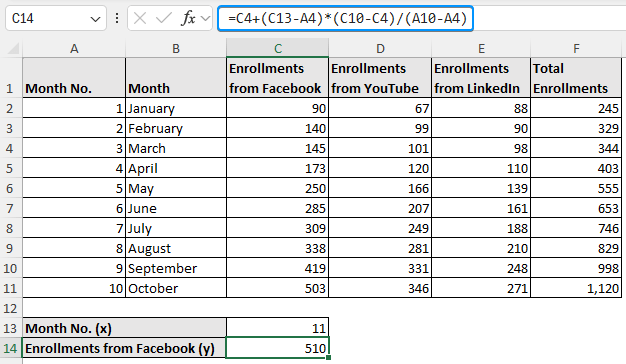
Linear Extrapolation
Linear extrapolation is the process of extending a straight line trend based on historical data to estimate unknown future values. Linear extrapolation assumes a constant rate of change between the dependent and independent variables, making it ideal for linear trends. The formula for linear extrapolation is given below:
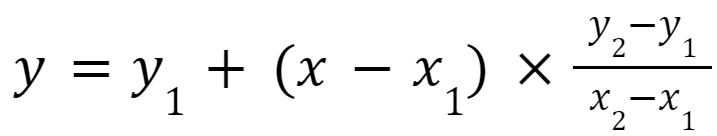
where
➤ x: value to interpolate.
➤ x1 and x2: known values of x
➤ y1 and y2: known values of y
Using Arithmetic Formula to Perform Linear Extrapolation
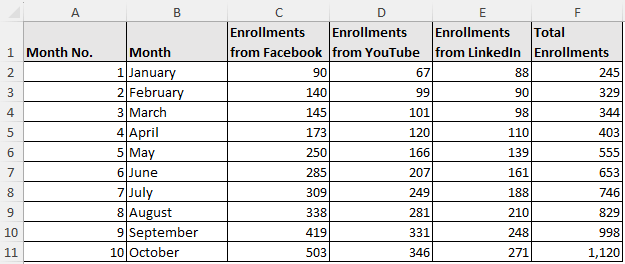
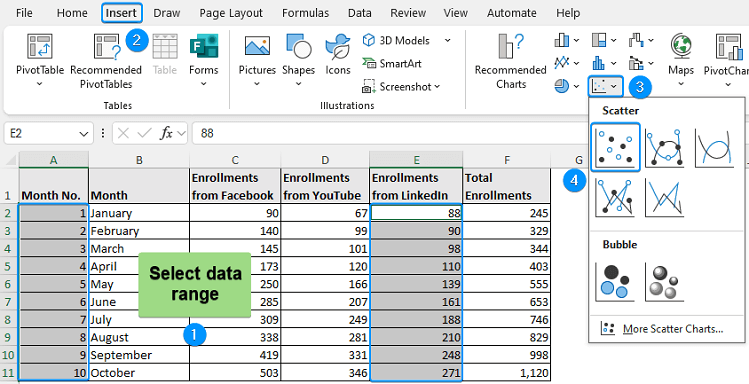
The online course enrollment data contains the month no, month, enrollments from Facebook, enrollments from YouTube, enrollments from LinkedIn, and total enrollments columns from A through F.
Suppose you are predicting November and December enrollments (Months 11 and 12) by examining monthly enrollment data. Here month no. is the independent variable and enrollments from various platforms are the dependent variables.
You can use linear extrapolation to forecast the enrollments since this data displays an upward trend in total enrollments across different platforms.
The conventional two point linear extrapolation formula is discussed in the first method. It is a simple way to forecast values with only two known data points. However, this is a manual approach and the two data points should be spaced apart for accurate results.
Steps:
➤ Enter the formula for linear extrapolation.
=C4+(C13-A4)*(C10-C4)/(A10-A4)
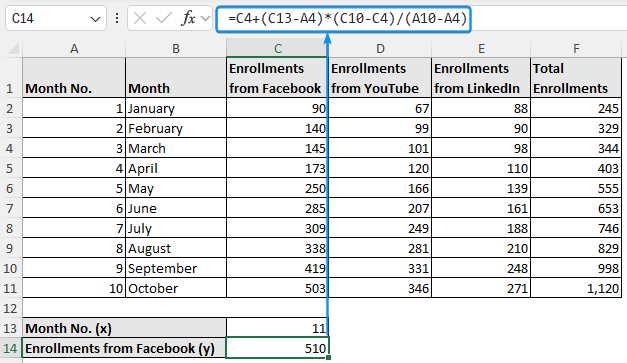
The estimated enrollment from Facebook for November (month 11) is 510.
Linear Expolation with Excel’s LINEST Function
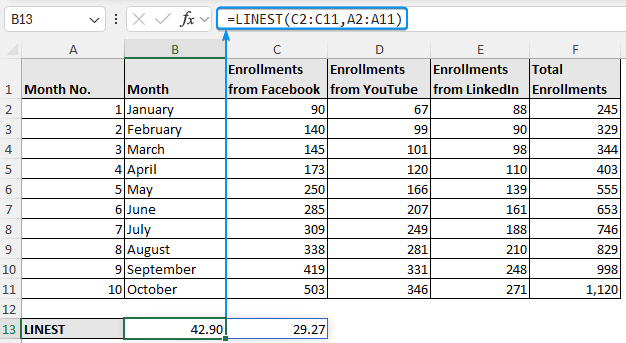
The LINEST function returns various statistics for the line of best fit depending the provided argument. This function returns the results as an array and for older versions of Excel you’ll need to press Ctrl + Shift + Enter . On earlier versions of Excel, just pressing Enter returns the array. The LINEST function is useful for providing a quick summary of the data, but it can be challenging to determine which value corresponds to which statistic.
Steps:
➤ The LINEST function returns the slope and y intercept of the line of best fit.
➤ Enter the LINEST function in cell B13 >> For earlier version of Excel press Ctrl + Shift + Enter . On newer versions, just press Enter .
=LINEST(C2:C11,A2:A11)
➤ Using the slope and the y intercept, construct a linear equation in the form:
slope * (x) + intercept
=B13*C14+C13
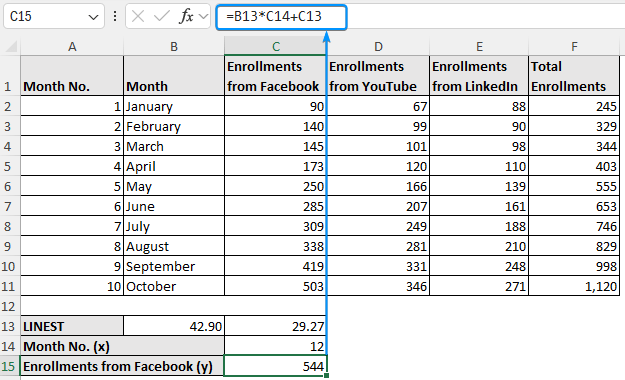
➤ The forecasted enrollment from Facebook for December (month 12) is 544.
Linear Extrapolation in Excel with TREND Function
The TREND function forecasts data based on known data points by using the least squares method. This is suitable for a quick extrapolation based on the available historical data. For best results, the dataset must exhibit a linear pattern over time.
Steps:
➤ Select the output cell (C14) >> Type the TREND function >> Enter the following inputs.
=TREND(D2:D11,A2:A11,C13)
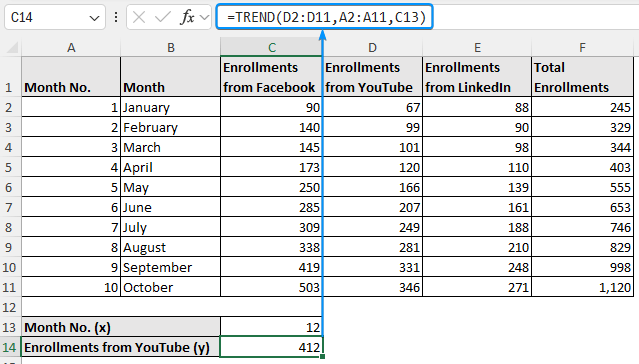
➤ The projected enrollment from YouTube for December (month 12) is 412.
Using FORECAST.LINEAR Function
Excel’s FORECAST.LINEAR or FORECAST function predicts future values for a linear trend using existing known values. It is also similar to the TREND function discussed earlier and requires a linear trend for reliable extrapolation.
Steps:
➤ Move to cell C14 and type the FORECAST or FORECAST.LINEAR function.
=FORECAST.LINEAR(C13,E2:E11,A2:A11)
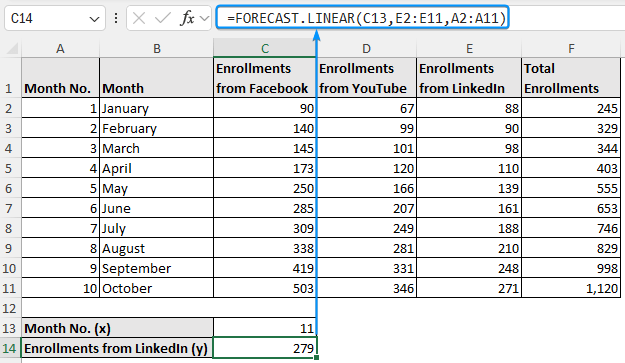
➤ The estimated enrollment from LinkedIn for November (month 11) is 279.
Using Trendline to do Linear Extrapolation in Excel
The Trendline approach fits a line or curve through the data points using Excel’s Trendline feature. Once the equation of the line is determined, simply plug a future independent variable (x) value to forecast the dependent variable (y) value. This method is suitable for a fast visual representation without much calculation.
Steps:
➤ Select the data >> Go to the Insert tab >> Select Scatter or Bubble >> Scatter.
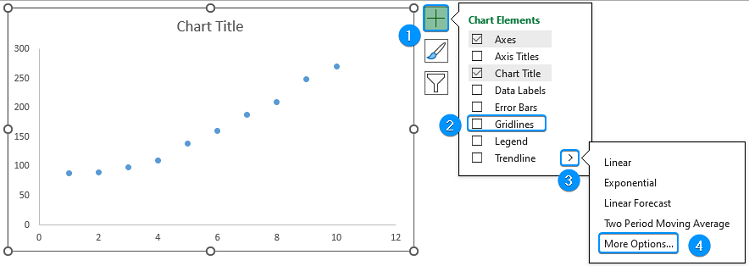
➤ Click on Chart Elements (plus icon) >> Uncheck Gridlines >> Click the arrow beside Trendline >> More Options.
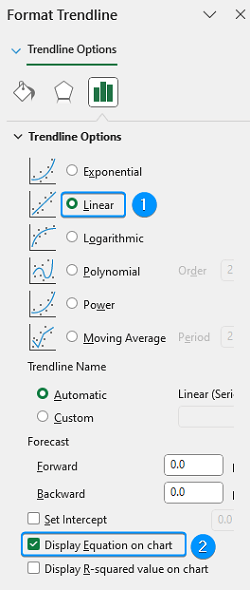
➤ In the Format Trendline pane, choose Linear option >> You may need to choose other options depending on linear or nonlinear data >> Enable Display Equation on chart to show the equation of the trendline.
➤ Click on the equation >> Press Ctrl + C to copy the expression.
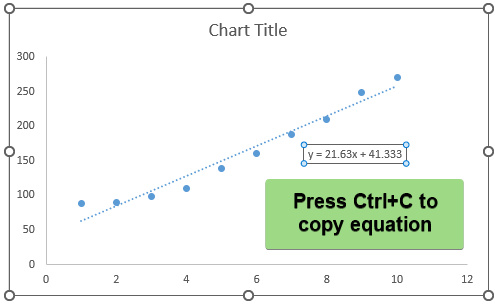
➤ Paste the formula (cell C14) >> Plug in x values (month no. 12) in the formula.
=21.63*C13+41.333
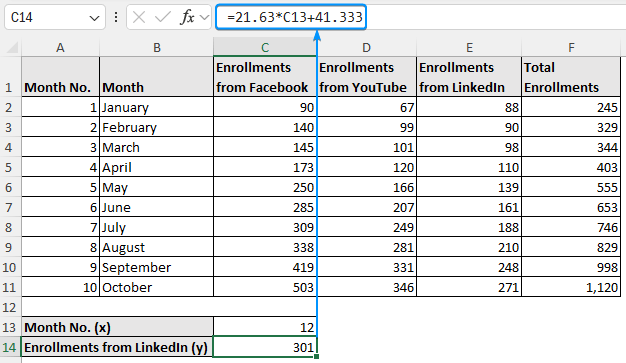
➤ The projected enrollment from LinkedIn for December (month 12) is 301.
FAQ
What is data extrapolation?
Data extrapolation estimates values beyond the known data points based on the assumption the trend of the data continues.
How to do linear extrapolation in Excel?
=TREND(known_ys,[known_xs],[new_xs])
Or,
=FORECAST.LINEAR(x,known_ys,known_xs)
What is the linear extrapolation formula?
Formula for extrapolation: y = y1 + (x - x1) * (y2 - y1) / (x2 - x1)
What is the difference between linear extrapolation and interpolation?
Linear extrapolation predicts values that fall outside the known data range. In contrast, linear interpolation estimates values within a known range of data points.
Which method provides the most accurate results?
The results of all approaches are similar, given that the data is linear. Using the FORECAST. LINEAR or TREND function for ease of use and repeatability. However, for nonlinear data, use polynomial or exponential trendlines instead.
Wrapping Up
In this article, we’ve learned about linear extrapolation and five ways to perform linear extrapolation in Excel using arithmetic formula, LINEST, TREND, FORECAST.LINEAR functions and using the Trendline feature. Feel free to download the practice file and let us know which method you like the most.