Analysis of Variance (ANOVA) is an effective statistical method for determining if the averages of several groups differ considerably. Interpreting and drawing meaningful conclusions from the ANOVA results requires understanding how to evaluate the data. This article will teach you how to interpret ANOVA results in Excel. Whether you are a business analyst, researcher, or student, this article will help you spot significant differences in group averages through examples.
➤ One way ANOVA determines any significant difference in the mean of multiple groups. In this article, we’ll use Data Analysis ToolPak to perform and interpret the ANOVA test results in Excel for the one way and two way ANOVA test.
➤ Two way ANOVA determines the effect of two independent categorical factors on a continuous dependent variable.
➤ Replication means having multiple observations in each group. Whereas, taking only one observation under each set of conditions represents without replication.
➤ If F statistic > F critical, reject the null hypothesis and vice versa.
➤ If the P value < significance level, reject the null hypothesis and vice versa.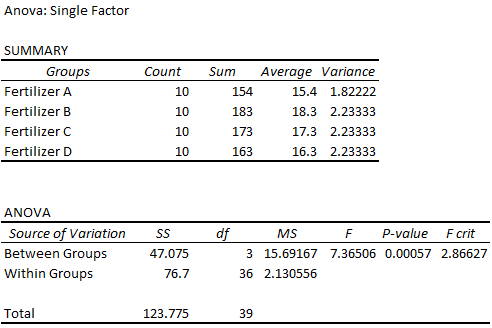
One Way or Single Factor ANOVA
One way or Single Factor ANOVA determines if there is any significant difference between the average of three or more groups. Like other hypothesis tests, one way ANOVA uses sample data to make inferences about the entire population.
The one way ANOVA test has the following hypotheses:
- Null hypothesis: The group means are the same.
- Alternate hypothesis: There is a difference between the group means.
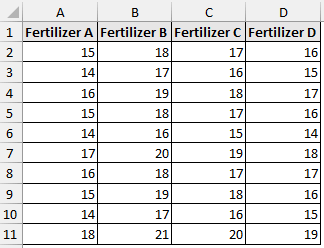
This dataset compares the plant growth (in cm) for four different fertilizers. We have 10 samples for each fertilizer and want to determine whether the mean plant growths differ using the four fertilizers.
Prior to performing the ANOVA tests, make sure to activate the Data Analysis ToolPak. To enable the add-in follow this steps:
File tab >> Options >> Excel Add-ins >> Data Analysis >> Ok.
Performing One Way ANOVA
Data tab >> Data Analysis >> ANOVA: Single Factor >> Input range >> Labels >> Output range >> OK.
Check out our article on one way ANOVA for detailed steps.
Excel generates the Summary table and ANOVA tables. Let’s learn how to interpret ANOVA results in Excel by interpreting the values in the table.
➥ Summary Table:
- Groups: The group names.
- Count: The total number of data points in each group
- Sum: The sum of all the values added together in each group.
- Average: The central value value in each group.
- Variance: The average difference of the values from the mean for each group.
The average growth varies for each group. Fertilizer B has the highest average growth.
➥ ANOVA Table:
We need the ANOVA table to determine if the differences in the group averages are statistically significant.
- Source of Variation: The variation is measured between and within groups.
- SS: The sum of squares for each group.
- df: Degrees of freedom.
- Between Groups: number of groups – 1.
- Within Groups: total number of observations – number of groups.
- MS: The mean sum of squares. MS = SS / df
- F: The F statistic. F = MS Between / MS Within.
- P value: The probability corresponding to the F statistic.
- F crit: The critical F value for the significance level 0.05.
The F statistic is greater than the F critical value (7.36506 > 2.86627). Reject the null hypothesis. The four means are not the same, at least one of the means is different.
The P value (0.00057) is less than the significance level (0.05). Therefore, reject the null hypothesis. There is significant evidence that the four means are not the same.

Two Way ANOVA: With Replication
A two way ANOVA determines the effect of two independent categorical factors on a continuous dependent variable.
Replication means having multiple observations in each group. For example, five plants were treated with fertilizer A and watered daily, five plants were treated with fertilizer B and watered on alternate days, and so on.
Two way ANOVA assesses:
- The individual impact of each factor on the dependent variable.
- Whether the effect of one factor depends on the other factor.
The two way ANOVA test has the following hypotheses:
Null hypothesis 1: The means of observations grouped by one factor are the same, that is, there is no difference in the daily, alternate days, and weekly water frequency.
Alternate hypothesis 1: There is a difference in the means.
Null hypothesis 2: The means of observations grouped by the second factor are the same, in other words, there is no difference in the fertilizers A, B, and C.
Alternate hypothesis 2: There is a difference between at least two of them.
Null hypothesis 3: There is no interaction between the two factors, i.e. the effect of fertilizer is not dependent on the water frequency.
Alternate hypothesis 3: There is an interaction.
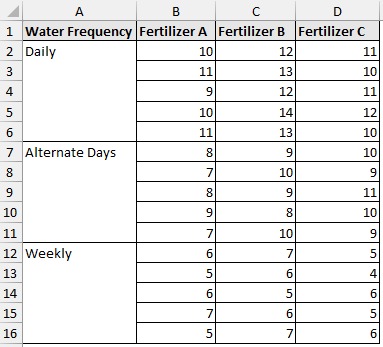
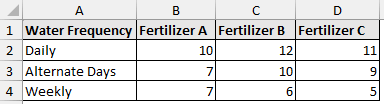
This dataset examines the effect of water frequency and fertilizer type on plant growth (in cm). For each combination of water frequency and fertilizer type, five observations were recorded.
Conducting Two Way ANOVA With Replication
Data tab >> Data Analysis >> ANOVA: Two Way With Replication >> Input range >> Rows per sample >> Significance level >> Output range >> OK.
For detailed steps check the article on two way ANOVA.
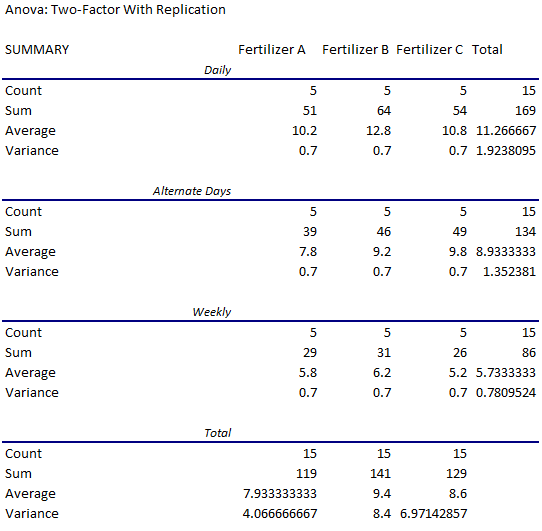
The summary tables for each combination of water frequency and fertilizer are shown below.
➥ Summary Table:
- The average growth of plants watered daily and treated with fertilizer A was 10.2 cm.
- The average growth of plants watered on alternate days and treated with fertilizer B was 9.2 cm.
- The average growth of all the plants watered weekly was 5.733 cm (rounded to 3 dp).
- The average growth of all the plants treated with fertilizer C was 8.6 cm.
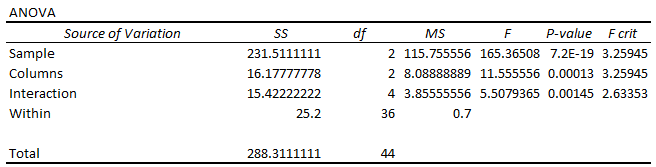
➥ ANOVA Table:
- The Sample row represents the water frequencies: daily, alternate days, and weekly.
- The F statistic is greater than the F critical value (165.3650794 > 3.259446).
- The P value is also less than the significance level (7.16E-19<0.05).
- So reject the null hypothesis (means of water frequencies are the same) and accept the alternative hypothesis that they are different.
- The Columns row represents the fertilizers A, B, and C.
- The F statistic exceeds the F critical value (11.55555556 > 3.259446).
- The P value is less than the significance level (0.000133<0.05).
- Therefore reject the null hypothesis (means of fertilizers are the same) and accept the alternative hypothesis that there is a difference between at least two factors.
- For the Interaction row:
- The F statistic is greater than the F critical value (5.507936508 > 2.633532).
- The P value is less than the significance level (0.00145 < 0.05).
- Reject the null hypothesis (no interaction between water frequency and fertilizer) and accept the alternative hypothesis that there is an interaction between them.
- The growth of plants is dependent on the water frequency and fertilizer used.
Two Way ANOVA: Without Replication
Taking only one observation under each set of conditions represents without replication. This significantly reduces the sample size.
The null hypotheses will be the same as two way ANOVA with replication.
This dataset below illustrates without replication. It has one data point for the combination of fertilizer A and water frequency daily, and so on for the other two.
Performing Two Way ANOVA Without Replication
Data tab >> Data Analysis >> ANOVA: Two Way Without Replication >> Input range >> Labels >> Significance level >> Output range >> OK.
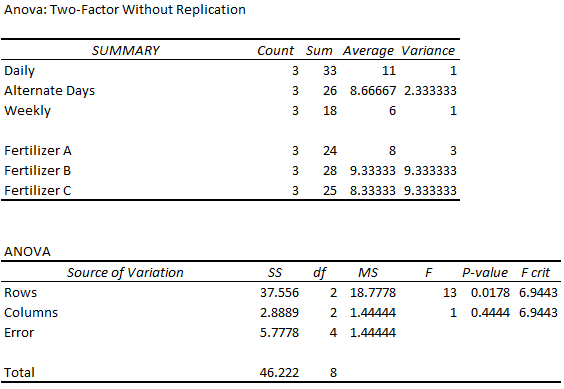
➥ Summary Table:
- The average growth of all the plants watered daily is 11 cm.
- The average growth of all the plants treated with fertilizer A is 8 cm.
➥ ANOVA Table:
- For the Rows, the F statistic is greater than the F critical value and the P value is less than the significance level. So reject the null hypothesis and accept the alternative hypothesis that means of water frequencies are different.
- For the Columns, the F statistic is less than the F critical value and the P value is greater than the significance level. So we fail to reject the null hypothesis that the means of fertilizers are the same.
Frequently Asked Questions
When to use the one way ANOVA test?
- Comparing the means of multiple independent groups.
- One independent categorical variable influences a continuous dependent variable.
How do I set up my data for one way ANOVA in Excel?
Each group should be in a separate column, where each row represents an observation within that group.
When to use the two way ANOVA test?
- Effect of two independent categorical factors on one dependent continuous variable.
- Examining the main effect (if each factor independently affects the dependent variable) and interaction effect (the effect of one factor depends on the other).
- Data replication (multiple observations for each set of factors)
How do I set up my data for two way ANOVA in Excel?
- Place the independent categorical factors along the rows and columns.
- The cells within this table should contain the dependent continuous data.
- There may or may not be replications for each set of combinations of the two factors.
How to read ANOVA test results?
Check the F statistic:
- If F statistic > F critical, reject the null hypothesis.
- If F statistic < F critical, cannot reject the null hypothesis.
Check the P value:
- If the P value < significance level, reject the null hypothesis.
- If the P value > significance level, cannot reject the null hypothesis.
Wrapping Up
In this tutorial, we’ve learned how to interpret ANOVA results in Excel for the one way ANOVA test and the two way ANOVA test with replication and without replication conditions. Feel free to download the practice file and let us know which method you like the most.