When making business decisions or analyzing models in Excel, it is crucial to understand how changing a single variable can influence your results. A one-variable data table helps you do exactly that. It allows you to test multiple values for a single input and observe how those changes affect a specific result, like profit, total cost, or EMI. In this tutorial, we will show you how to create a one-variable data table in Excel for two different scenarios.
To create a one variable data table in Excel, follow the steps below.
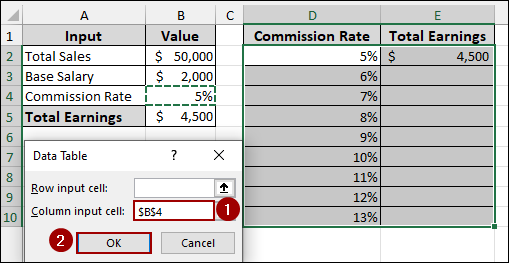
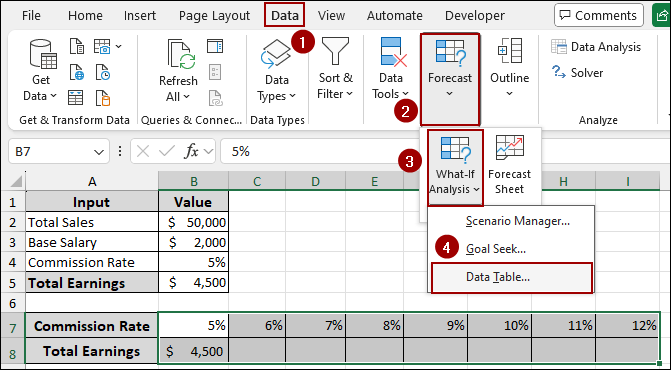
➤ Go to the Data tab, click What-If Analysis, and choose Data Table.
➤ In the Data Table dialog box:
➤ Leave the Row input cell blank, and in the Column input cell, select B4, since the column varies Commission Rate.
➤ Press OK. Excel will automatically calculate the Total Earnings for each Commission Rate listed in column D.
What is One Variable Data Table in Excel?
A one-variable data table in Excel is a built-in feature used for what-if analysis. It allows you to change one input value, such as price, interest rate, or quantity, and see how it impacts the outcome. The rest of your model stays the same, while Excel automatically calculates results for each input. This makes it easy to compare different scenarios side by side without rewriting formulas. One-variable data tables are especially helpful in budgeting, financial forecasting, and sensitivity analysis.
Creating One-Variable Data Table in Excel
Scenario 1
In this part, we will create a one-variable data table for a business model. We will begin by creating a basic dataset. Then use the Data Table, which will help us understand how changes in the Commission Rate affect Total Earnings.
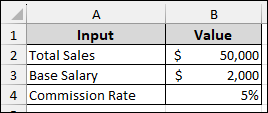
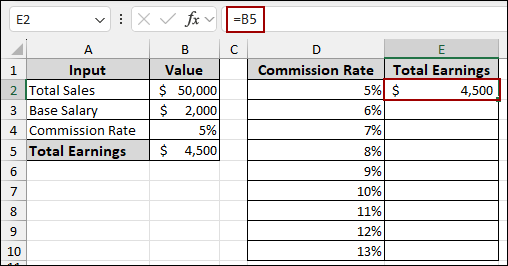
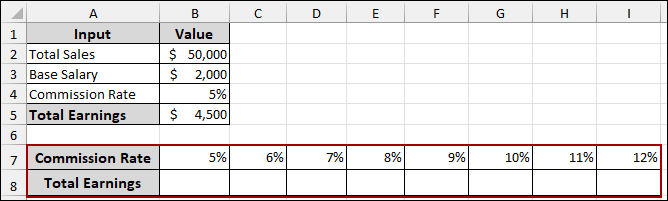
Suppose we have a sample dataset containing Total Sales: $50,000, Base Salary: $2,000, Commission Rate: 5%.
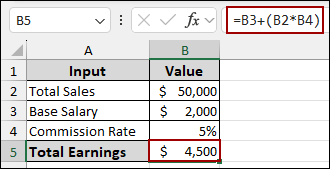
First, we will calculate the initial Total Earnings based on the provided inputs.
➤ In cell B5, write down the formula below.
=B3+(B2*B4)
This formula adds the Base Salary to the product of Total Sales and Commission Rate.
Now, we will set up the structure for our Data Table. This involves creating a list of different Commission Rates and referencing the Total Earnings formula.
➤ In the range D2:D10, input the different Commission Rates you want to analyze, for example, from 5% to 13%.
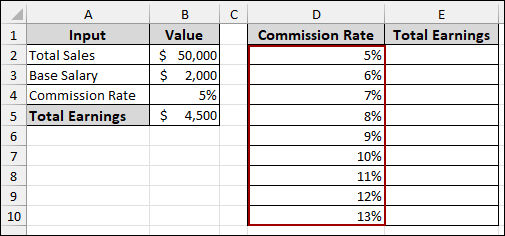
➤ In cell E2, put the following formula.
=B5
This links the Total Earnings calculation to the header of our data table.
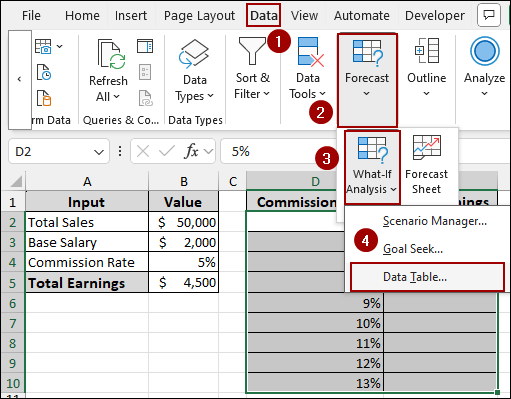
Here, we will use the Data Table feature to automatically calculate Total Earnings for each Commission Rate.
➤ Select the entire range of your data table, which is D2:E10.
➤ Go to the Data tab in the Excel ribbon.
➤ In the Forecast group, click on What-If Analysis.
➤ From the dropdown menu, select Data Table.
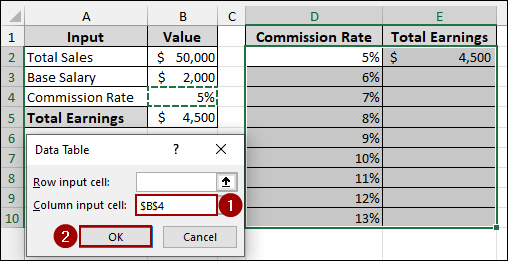
The Data Table dialog box will appear.
➤ Since our variable (Commission Rate) is in a column, leave the Row input cell field blank.
➤ In the Column input cell field, select cell B4 (the original Commission Rate input).
➤ Click OK.
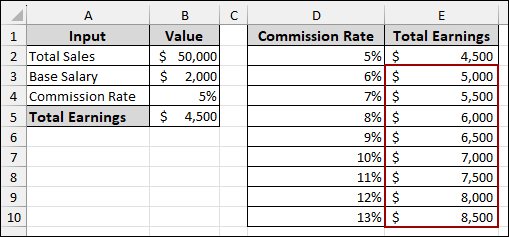
As a result, Excel will populate the Total Earnings column in your data table, showing how the earnings change with each different Commission Rate.
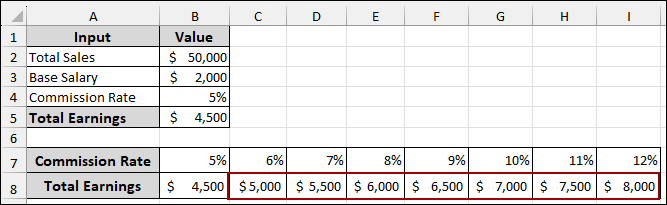
Similarly, we will create a row-oriented data table to analyze how different Commission Rates impact Total Earnings. This approach is useful when you want to see the results spread horizontally.
➤ First, prepare the row headers for your data table. In cells B7:I7, enter the various Commission Rates you want to test (5% to 12%).
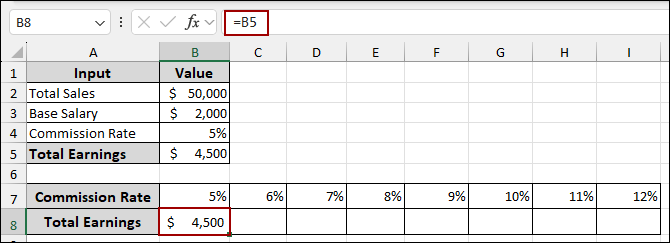
➤ In cell B8, link the Total Earnings calculation by entering the formula.
=B5
➤ Select the entire range of your data table, which is B7:I8.
➤ Go to Data > Forecast > What-If Analysis > Data Table.
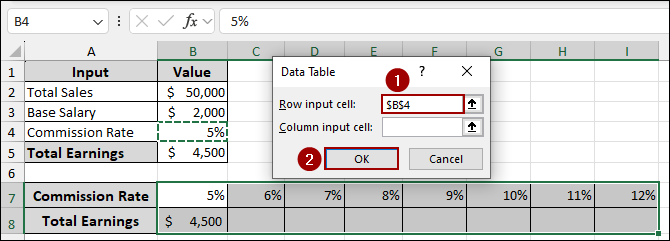
The Data Table dialog box will appear.
➤ In the Row input cell field, select cell B4 (the original Commission Rate input).
➤ Leave the Column input cell field blank, as our variable is in a row.
➤ Click OK.
As a result, the Total Earnings for each Commission Rate will be automatically generated in row 8 of your data table.
Scenario 2
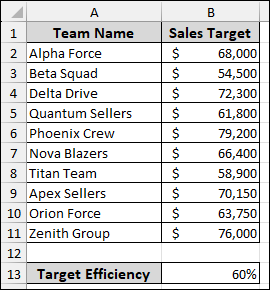
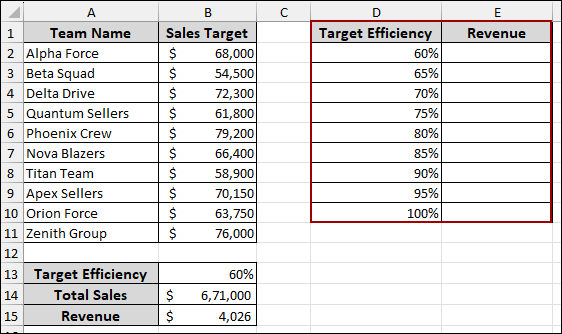
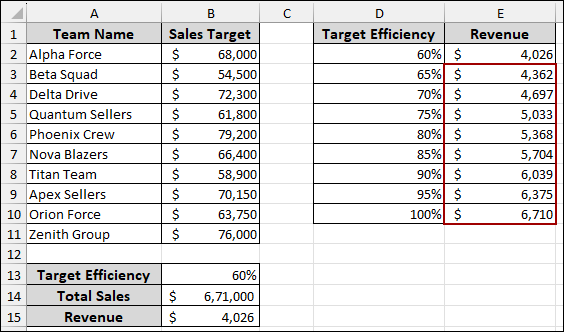
Suppose we have a dataset including Team Names and their respective Sales Targets, and a Target Efficiency of 60%. Now, we will use a one-variable data table to analyze how changing the efficiency percentage affects the revenue.
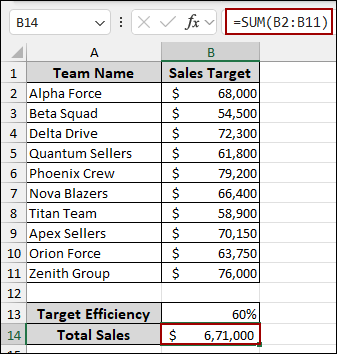
First, we will calculate the Total Sales by summing up all the individual sales targets.
➤ In cell B14, enter the formula below.
=SUM(B2:B11)
The Total Sales will be calculated.
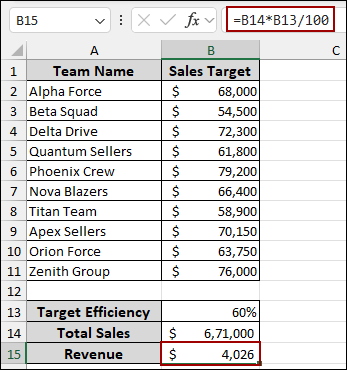
Next, we will calculate the Revenue by applying the Target Efficiency to the Total Sales.
➤ Select cell B15 and write down the formula.
=B14*B13/100
This will provide the Revenue at the current efficiency.
To analyze the impact of varying efficiencies on revenue, we’ll set up a data table.
➤ In the range D2:D10, list the different Target Efficiency percentages you wish to analyze, for example, from 60% to 100% in 5% increments.
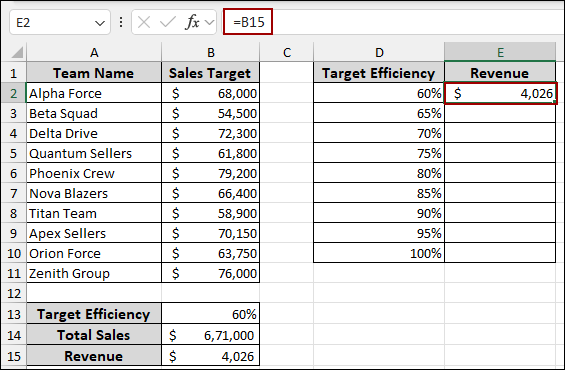
➤ In cell E2, link the Revenue calculation by entering the formula.
=B15
Now, we will use the Data Table feature to automatically calculate the Revenue for each specified Target Efficiency.
➤ Select the entire range for your data table, which is D2:E10.
➤ Go to Data > Forecast > What-If Analysis > Data Table.
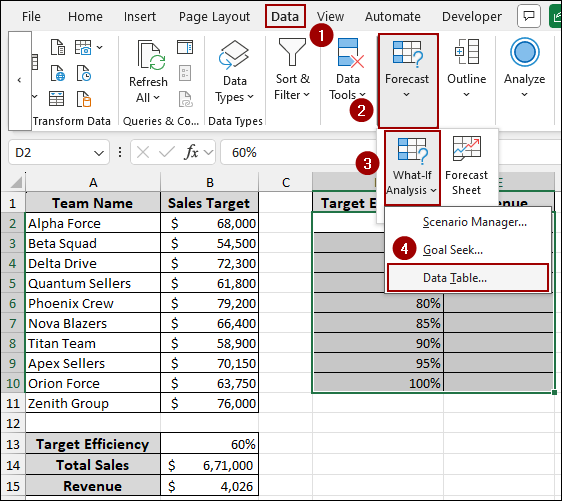
The Data Table dialog box will appear.
➤ Since our variable (Target Efficiency) is in a column, leave the Row input cell field blank.
➤ In the Column input cell field, select cell B13 (the original Target Efficiency input).
➤ Click OK.
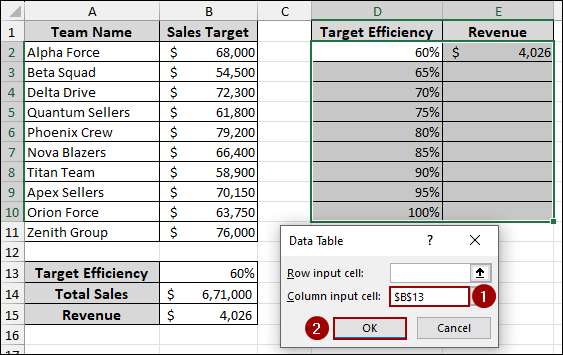
As a result, Excel will populate the Revenue column, showing the projected revenue at each different Target Efficiency level.
Frequently Asked Questions
Why is my data table not calculating?
Make sure automatic calculation is enabled under Formulas > Calculation Options. Also, verify that the input cell reference is correct and that you’re using Data > What-If Analysis > Data Table properly.
Does the input cell need to be in the same worksheet as the data table?
Yes, for a data table to work properly, the input cell must be on the same sheet where you create the data table.
Are data tables the same as Pivot Tables?
No, a data table is a tool for what-if analysis and sensitivity testing, while a pivot table is used for summarizing and analyzing large datasets.
Concluding Words
Above, we have explored how to create and use a one-variable data table in Excel to perform quick and effective what-if analysis. This tool allows you to test multiple input values and instantly see how they affect your result. Whether you’re evaluating sales projections, commission rates, or loan payments, one variable data tables make your analysis more dynamic and insightful. If you have any questions, feel free to drop them in the comments below.