A percent frequency distribution displays the percentage of observations within a certain interval or category compared to the total number of observations. You can use Excel functions and features to make a percent frequency distribution.
➤ A percent frequency distribution displays the percentage of observations in a certain category relative to the total.
➤ PivotTable: Insert >> PivotTable >> Show Value As >> % of Grand Total.
➤ Newer functions: =SORT(UNIQUE(array) >> =FREQUENCY(data_array, bins_array) >> =frequency/total.
➤ Older functions: Advanced filter >> Sort >> =COUNTIF(range, criteria) >> =frequency/total.
In this article, we’ll learn to create a percent frequency distribution using the PivotTable and Excel features & functions.
Using PivotTable
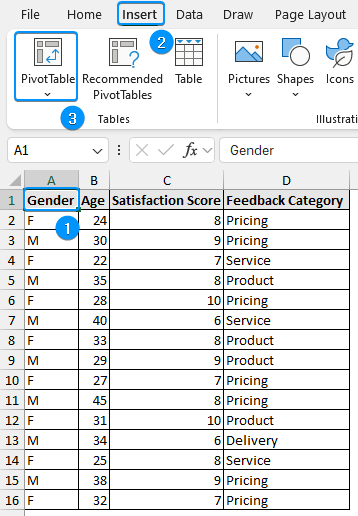
In this dataset, we have the gender in Column A, the age in Column B, the satisfaction score in Column C, and the feedback category in Column D. Let’s use PivotTable to make a percent frequency distribution for a categorical variable and a numerical variable.
Percent Frequency Distribution: Categorical Variable
We’ll create a percent frequency distribution for the feedback category variable.
Steps:
➤ Select any cell within the dataset >> Insert >> PivotTable.
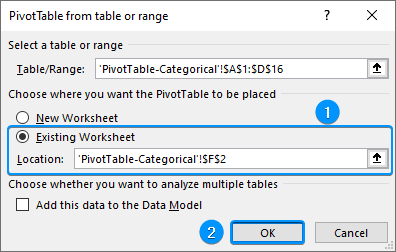
➤ Choose Existing Worksheet >> Location (F2) >> OK.
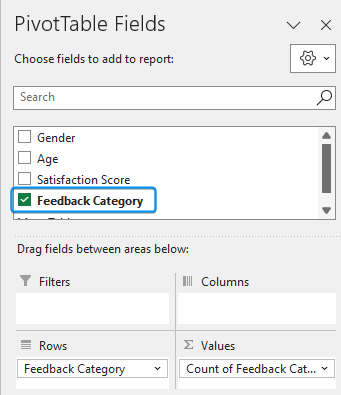
➤ Drag the feedback category field into the Rows area and Values area.
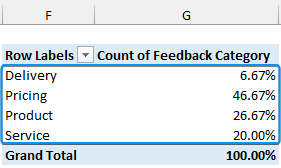
➤ Select any cell in the count of feedback category column >> Right-click >> Show Values As >> % of Grand Total.
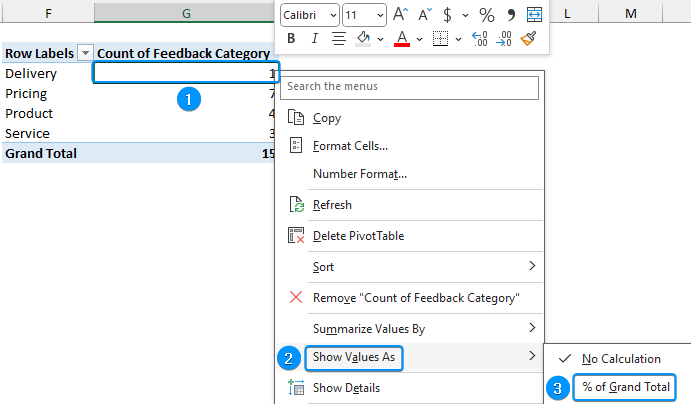
➤ The percent frequency distribution is ready.

Percent Frequency Distribution: Numerical Variable
Similarly, let’s create a percent frequency distribution for the satisfaction score variable.
Steps:
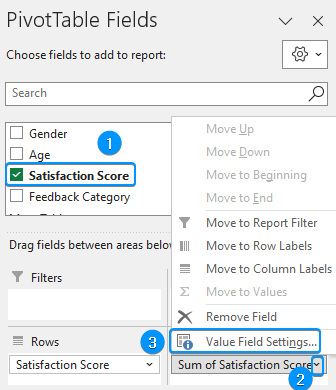
➤ Create a PivotTable like before >> Drag the satisfaction score field in the Rows and Values areas >> Click the drop-down arrow >> Value Field Settings.
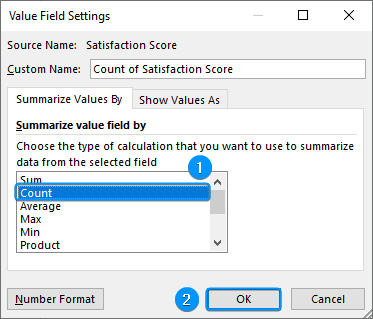
➤ Choose the Count option >> OK.
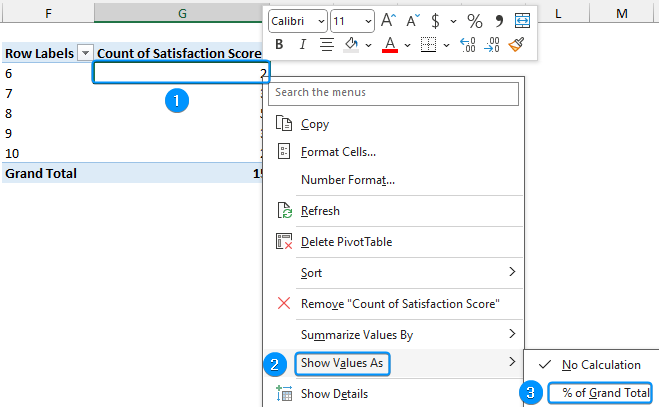
➤ Select any cell in the count of satisfaction score column >> Right-click >> Show Values As >> % of Grand Total.
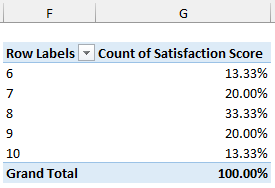
➤ This completes the percent frequency distribution.
Create Percent Frequency Distribution with Excel Functions
You can also use built-in Excel functions to construct a percent frequency distribution. Follow the steps depending on the newer or earlier versions of Excel.
Newer Versions of Excel
The newer version of Excel includes the UNIQUE and FREQUENCY functions. Let’s see them in action.
Steps:
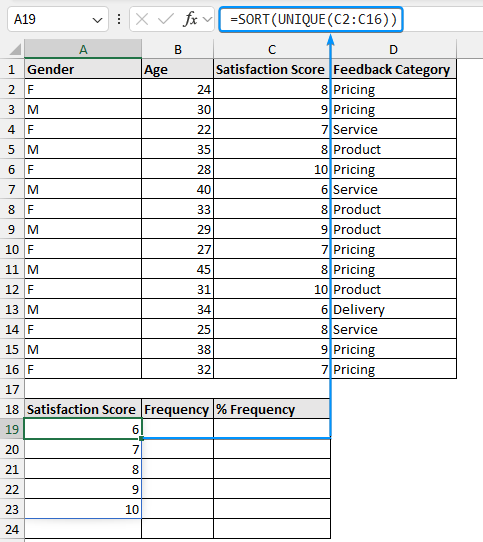
➤ Select the output cell (A19) and enter the formula to sort the unique values from smallest to largest.
=SORT(UNIQUE(C2:C16))
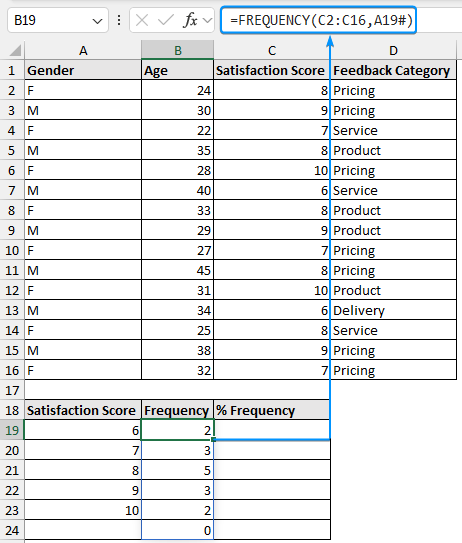
➤ Use the FREQUENCY function to count the number of occurrences. Press Ctrl+Shift+Enter .
=FREQUENCY(C2:C16,A19#)
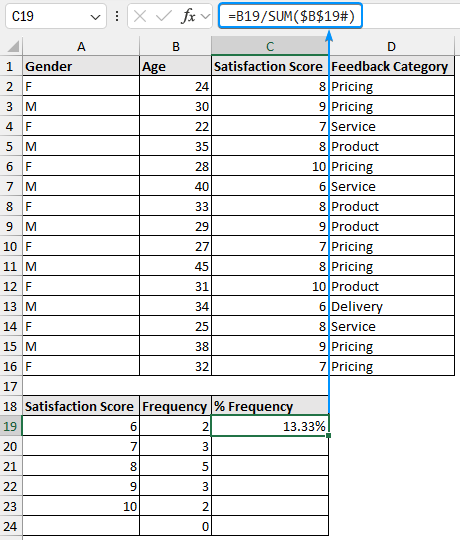
➤ Calculate the percent frequency distribution with this formula. Change the number formatting to percentage.
=B19/SUM($B$19#)
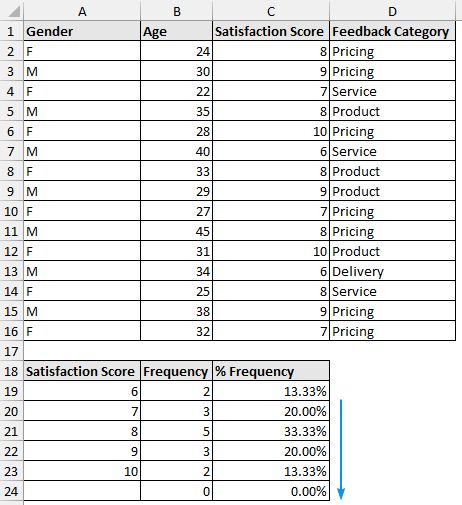
➤ Apply the Fill Handle tool to complete the percent frequency distribution.
Earlier Versions of Excel
Users of earlier versions of Excel need to perform Advanced filtering and sorting and then use the COUNTIF function.
Steps:
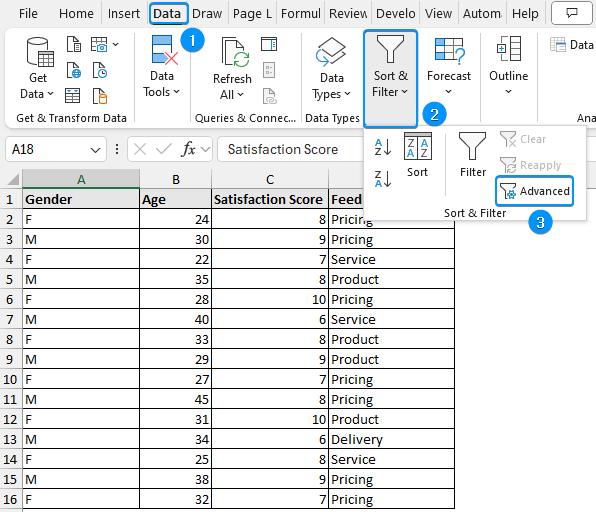
➤ Go to the Data tab >> Sort & Filter >> Advanced.
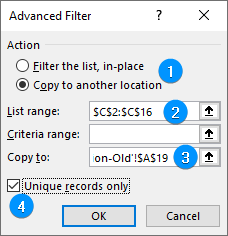
➤ Select Copy to another location >> List range (C2:C16) >> Copy to (A19) >> Check Uniques records only >> OK.
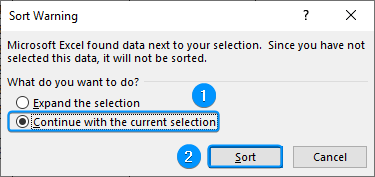
➤ Select the unique values >> Right-click >> Sort >> Sort Smallest to Largest.
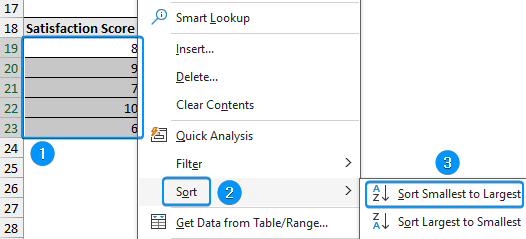
➤ Choose Continue with the current selection >> Sort.
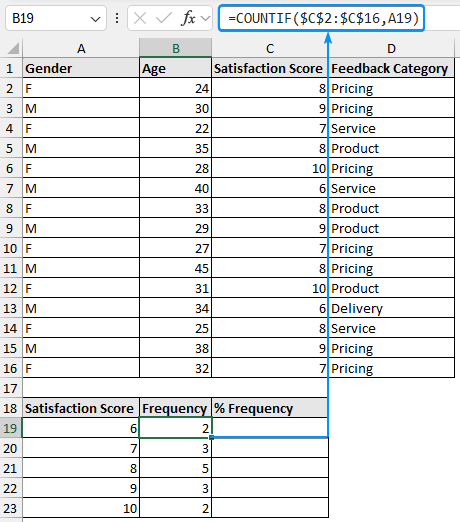
➤ Use the COUNTIF function to get the count of occurrence.
=COUNTIF($C$2:$C$16,A19)
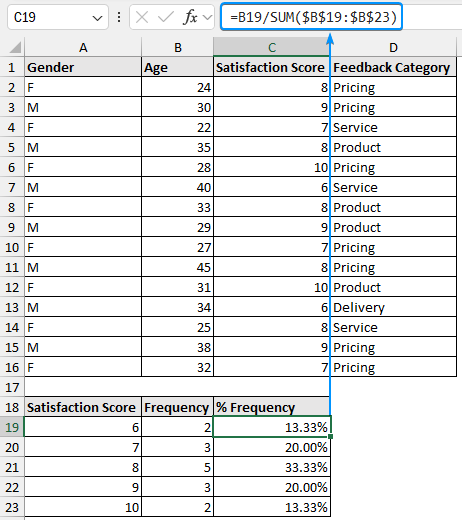
➤ Calculate the percent frequency distribution >> Use the Fill Handle to copy the formula to the cells below >> Apply percentage formatting.
=B19/SUM($B$19:$B$23)
FAQ
How do I calculate the percent frequency?
➤ Use the COUNTIF function to calculate the frequency of a category.
➤ Divide each frequency by the total number of observations and multiply by 100.
What is the formula for relative frequency?
Relative frequency =f/n.
Here f is the frequency of a specific observation and n is the total frequency.
How do you calculate cumulative frequency in Excel?
Cumulative frequency: =SUM($A$1:A1). Apply the Fill Handle tool to obtain the cumulative summation.
What is the frequency formula in Excel?
=FREQUENCY(data_array, bins_array)
How can I calculate frequency distribution?
To calculate frequency distribution:
➤ Define the bins.
➤ Enable Data Analysis ToolPak: File >> Options >> Excel Add-ins >> Data Analysis.
➤ Go to the Data tab >> Data Analysis >> Histogram >> Input range >> Bin range >> Output range >> OK.
Wrapping Up
In this tutorial, we’ve learned to make a percent frequency distribution in Excel using PivotTable and Excel features & functions. Feel free to download the practice file and let us know which method you like the most.