The logarithmic scale is the representation of multiplicative changes rather than additive changes. In other words, each step is a multiplication of the previous number on a logarithmic scale. It is helpful to represent a wide range of data. To change an axis to a logarithmic scale, Excel features the Logarithmic scale feature with different bases.
To change the axis to a logarithmic scale in Excel,
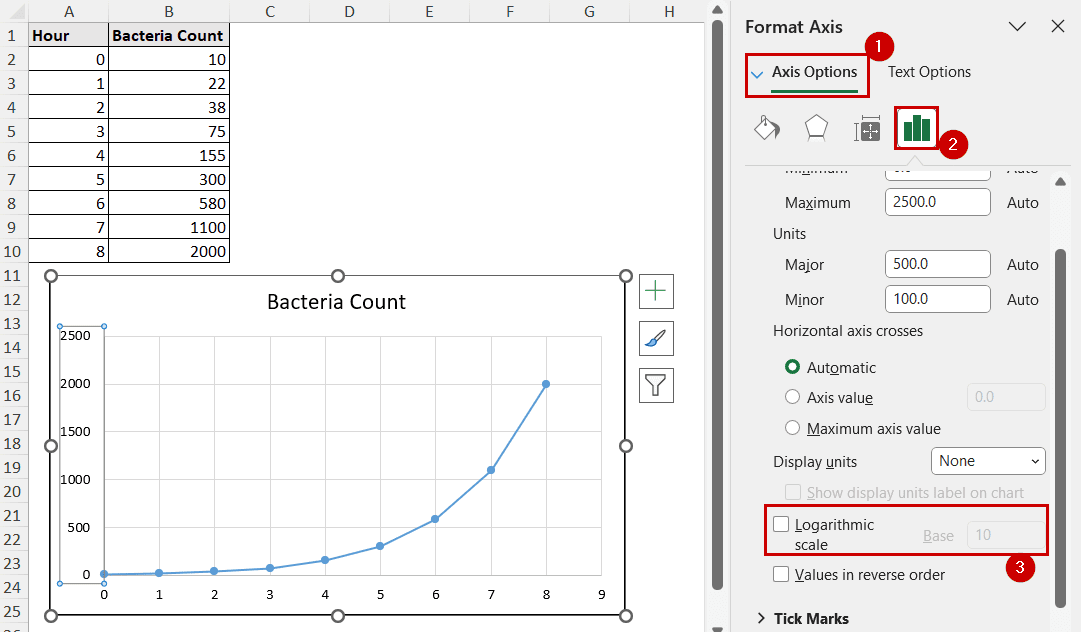
➤ Double-click on the scale you want to modify.
➤ In the Format Axis pane, go to Axis Options.
➤ Check the Logarithmic scale option and a suitable base.
In this tutorial, we’ll cover converting the axis to a logarithmic scale in Excel. In doing so, we are going to touch on how we can access the Format Axis pane differently for this option.
Download Practice WorkbookWhat is a Logarithmic Scale?
A logarithmic or log scale is a non-linear scale representing a wide range of data.
Linear scales increase additionally. For example, the most generally used linear scale increases from 1 to 2, 3, 4, etc. If it increased by 2 units, the numbers would have been 1, 3, 5, etc.
The logarithmic scale has a multiplicative increase. If a scale starts at 1 and it increases logarithmically by a factor of 5, the scale would be 1, 5, 25, 75,…
It is helpful to:
➤ Compress large values
➤ Make exponential relationships appear linear (exponential data forms a straight line on a log scale)
The logarithmic scale is most commonly used in the financial market (stock price trends), for scientific data (pH levels, Richter scale), and Biology (viral/bacterial growth curve).
Step-by-Step Process to Change Axis to Logarithmic Scale
In the latest versions of Excel, all options to change the axis scale are in the Format Axis pane.
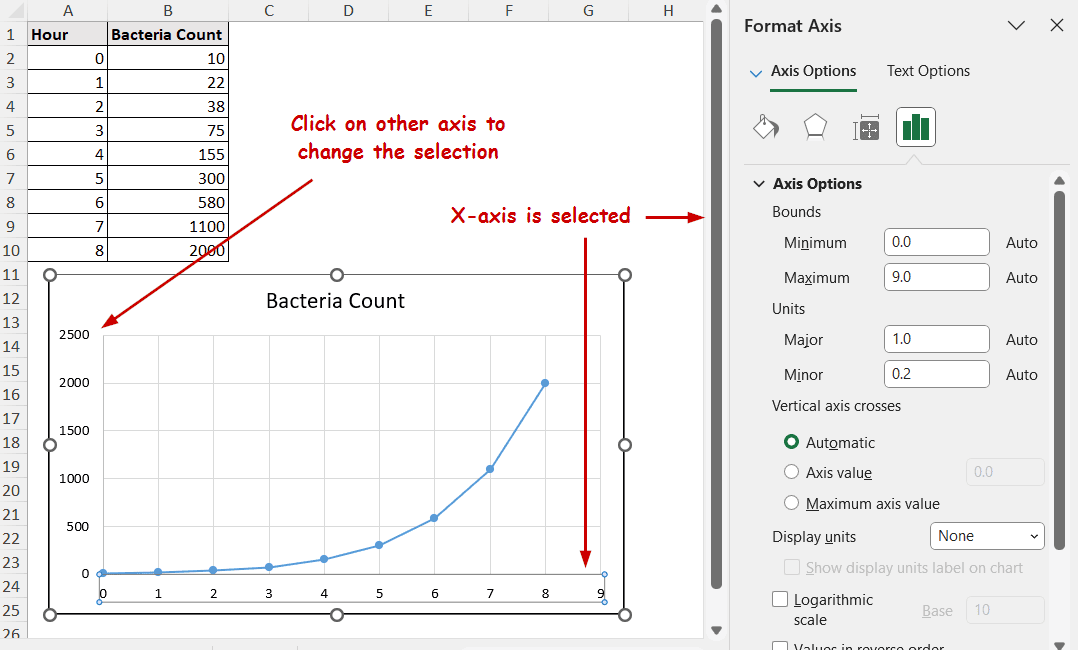
This is the data we are using for demonstration. The bacteria count increases exponentially over hours, and it fits the logarithmic scale perfectly.
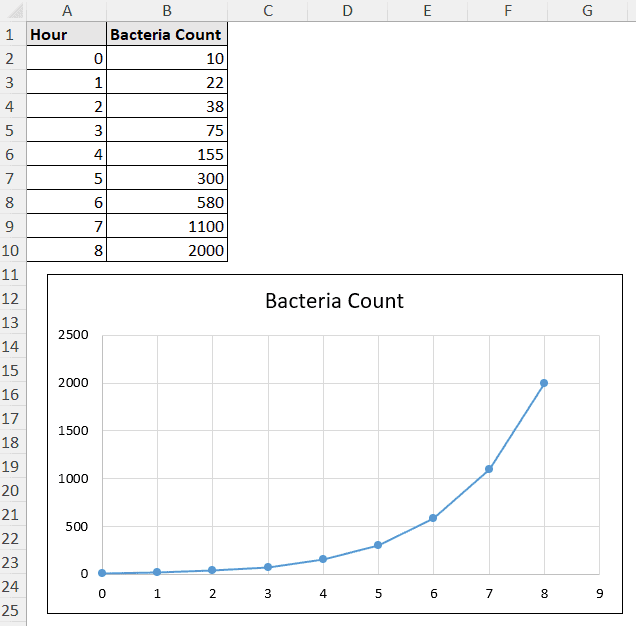
Here is how we can change the scale of bacteria count (Y-axis) to a logarithmic scale:
Step 1: Open the Format Axis Pane
There are different ways to open the Format Axis pane.
Directly Opening the Pane:
➤ The fastest way to open the Format Axis pane is to double-click the axis you want to format.
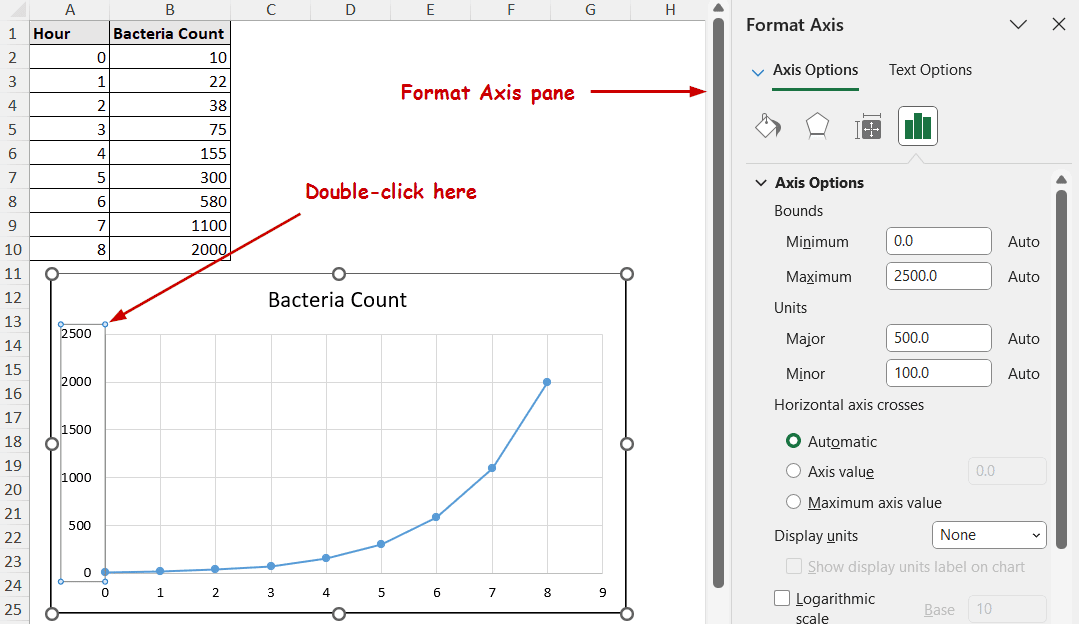
Chart Elements Button:
➤ Select the chart and click on the Chart Elements button on the top-right of the chart.
➤ Go to Axes >> More Options.
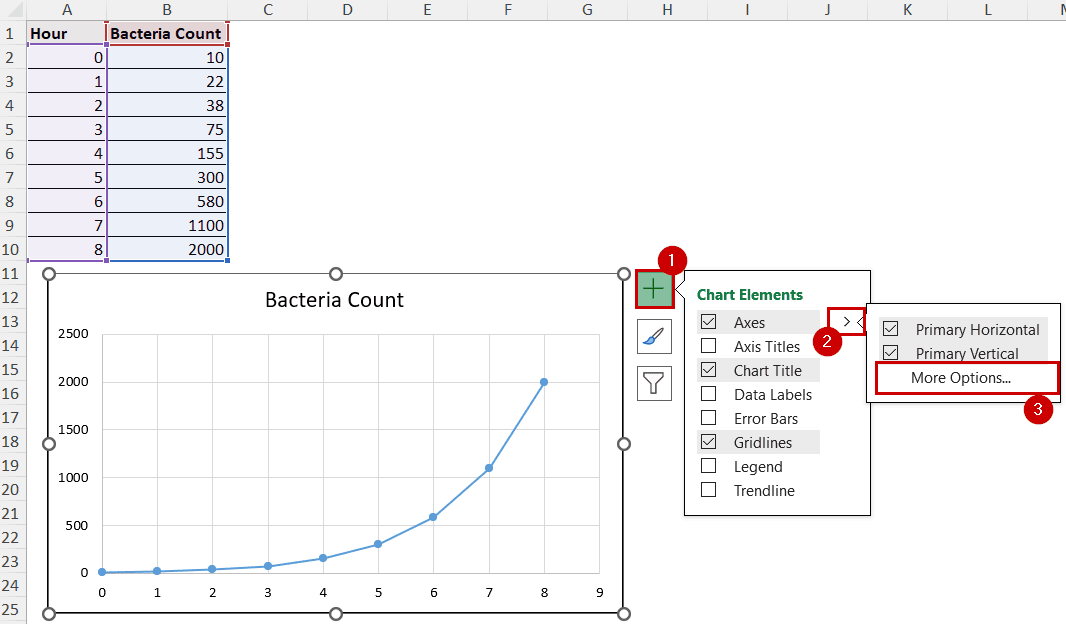
➤ Click on the axis you want to modify if it isn’t selected automatically.
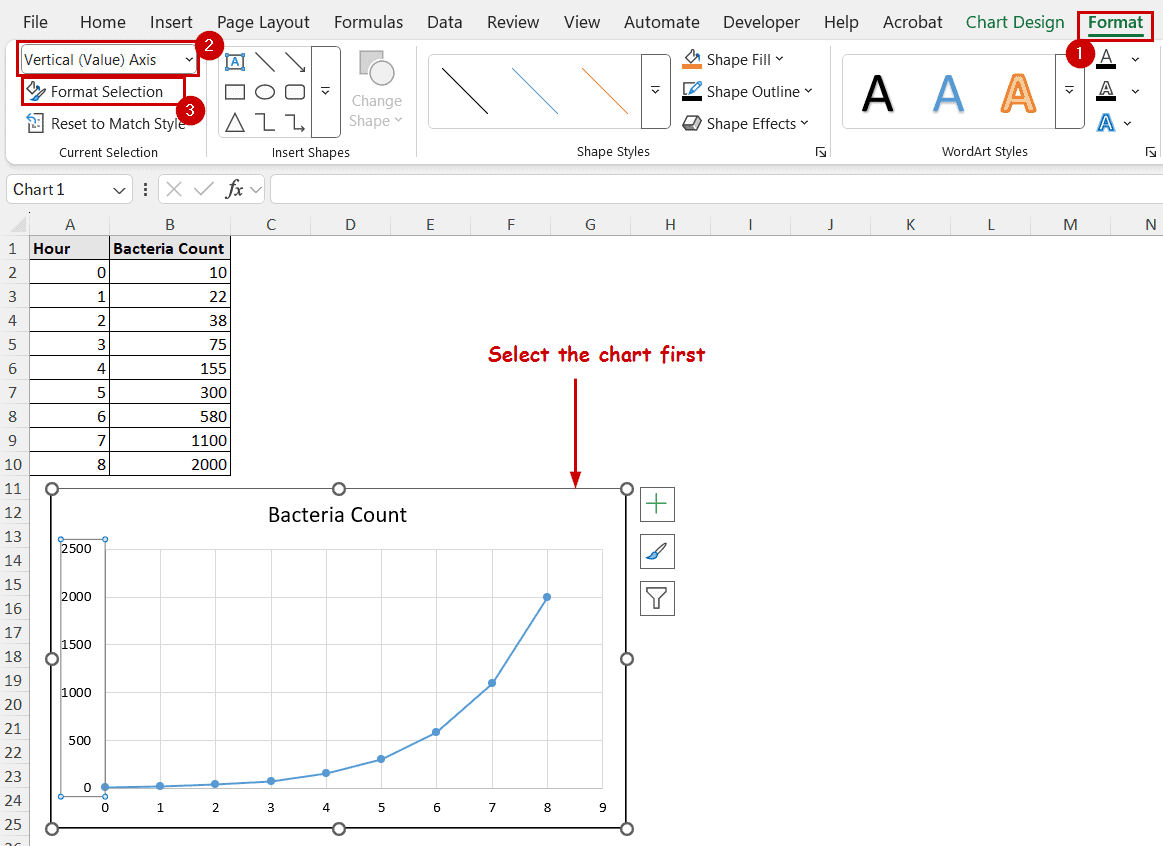
Format Tab:
➤ Select the chart.
➤ Go to the Format tab.
➤ Select the axis in the Current Selection (Vertical Axis in this case).
➤ Then select Format Selection.
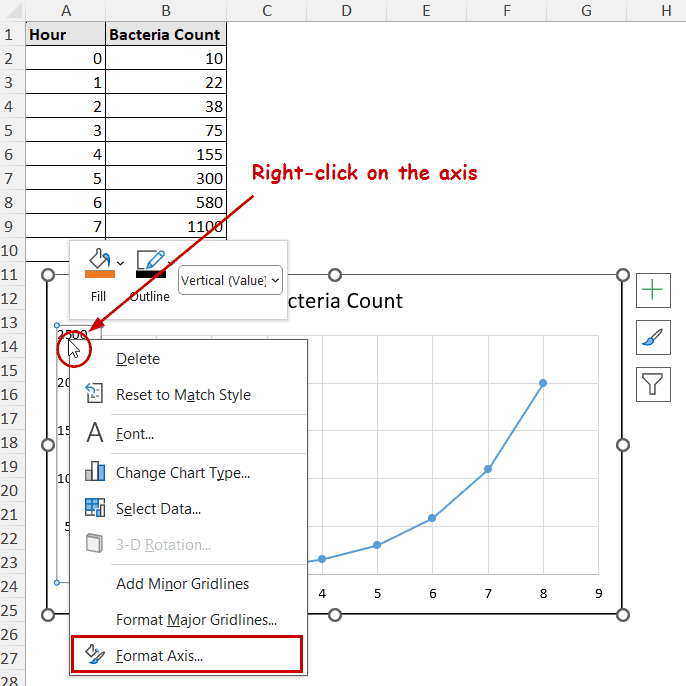
Using Context Menu:
➤ Right-click on the axis you want to modify.
➤ Select Format Axis from the context menu.
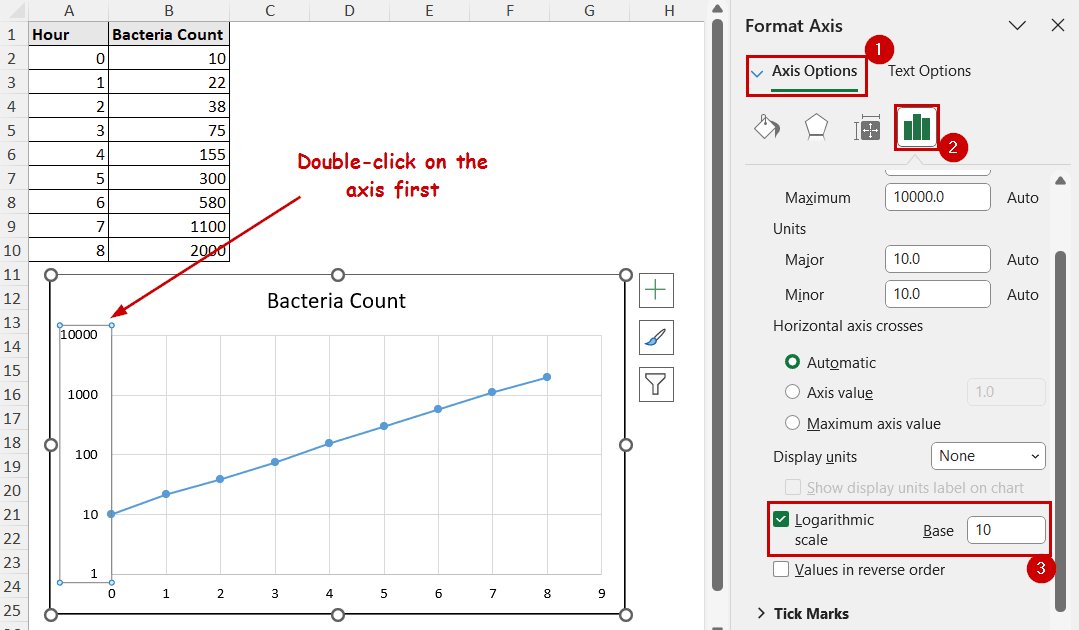
Step 2: Changing Axis Scale
Scale options are available under Axis Options of the Format Axis Pane.
➤ Select Axis Options (there are multiple “Axis Options” one under another).
➤ Check the Logarithmic scale option and select a Base value.
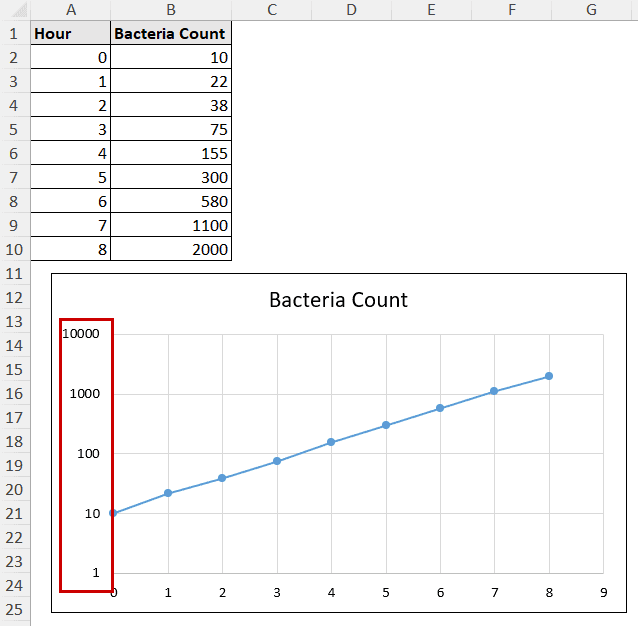
The same chart with a logarithmic scale looks like this now.
Logarithmic Scale on Horizontal Axis
Although less practical, the logarithmic scale option is available for the horizontal axis in Excel, too.
A logarithmic scale on the X-axis is less common in general business or data analysis. The horizontal axis usually involves categories, time, or other linearly increasing quantities.
However, the situation can be helpful for frequency domain analysis, plot material science stuff like particle size distributions, etc.
In that case, the logarithmic scale can be determined using the same method.
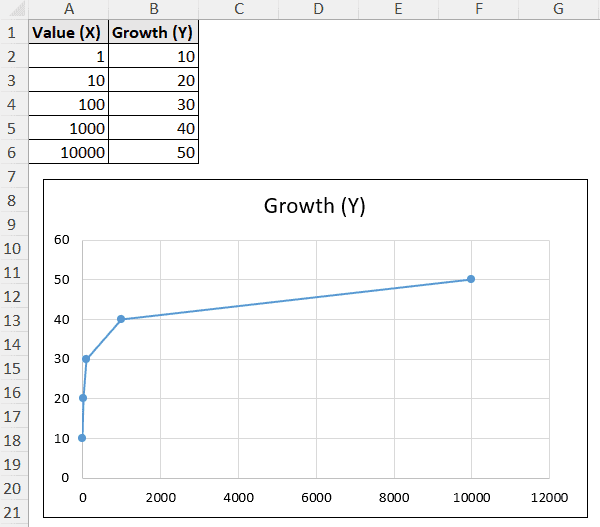
For example, let’s consider the following example where the X-axis has an exponential value growth.
To change the scale of the horizontal axis to logarithmic,
➤ Double-click on the horizontal axis.
➤ Go to Axis Options and check Logarithmic scale on the Format Axis pane.
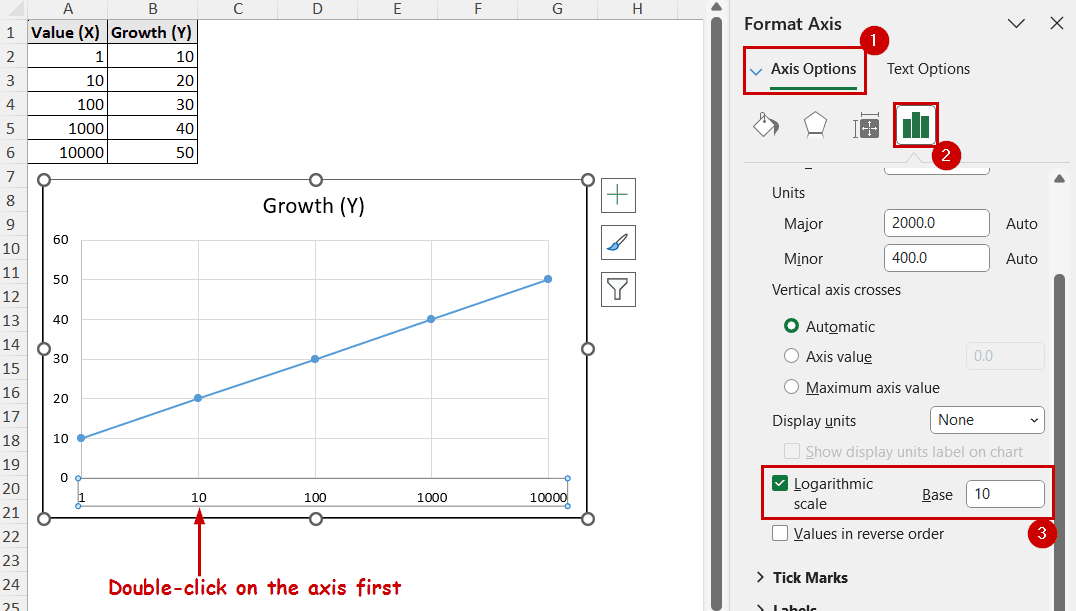
The method is the same for the horizontal and vertical axes.
FAQ
How to fix axis scale in Excel?
If you want to revert the axis from the logarithmic scale, uncheck the Logarithmic scale option.
If you made bound changes and want to get back the initial one, buttons labeled Reset will be available where you insert the values for the Minimum and Maximum fields. Click on those buttons to reset the scale.
Can I apply a logarithmic scale to negative values?
You can’t apply a logarithmic scale to negative values in Excel.
This is because of the nature of how the logarithmic function works. The log breaks down a value by the power of a base number (10 or e).
If ax=y, then loga(y)=x. The base (a) always has to be positive, and hence no negative value of x can raise it to a positive y.
What is the difference between linear and logarithmic scales?
In a linear scale, equal intervals mean equal differences. In the logarithmic scale, equal intervals are equal ratios.
For example, the distance between 1 and 10 in a logarithmic scale is a multiplication of 10. The distance between 10 and 100 is also a multiplication of 10 on a logarithmic scale.
Conclusion
In this tutorial, we have covered changing the axis scale to a logarithmic scale in Excel. The logarithmic scale option is available in the Format Axis pane. We have demonstrated how to access the pane in different ways. Although we have demonstrated with a logarithmic scale of base 10, the process can be followed for any positive base value.
Feel free to download the practice workbook and give us your feedback.