When constructing an investment portfolio, reducing risk is as important as increasing returns. The minimum variance portfolio offers the least possible risk for a certain level of expected return. This blog post explores the minimum variance portfolio and explains how to make a minimum variance portfolio in Excel using simple steps.
➤ A minimum variance portfolio offers the lowest risk for a given expected return. In this article, we’ll learn to make a minimum variance portfolio in Excel using MMULT and TRANSPOSE functions and the Solver Add-in.
➤ Excess returns: =cell_reference−AVERAGE(returns)
➤ Transpose matrix: =MMULT(TRANSPOSE(excess returns),excess returns)
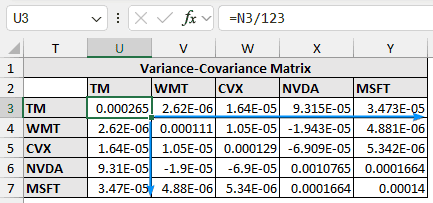
➤ Variance-covariance matrix: =N3/COUNT(observations)
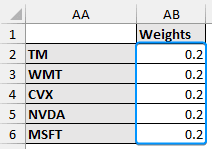
➤ Set weights arbitrarily. All the weights must add up to one
➤ Weight transpose matrix: =MMULT(TRANSPOSE(weights),variance-covariance matrix)
➤ Portfolio variance: =MMULT(weight transpose matrix,weights)
➤ Enable Solver: File >> Options >> Excel Add-ins >> Solver Add-in.
➤ Solver: Set objective >> Min >> By Changing Variable Cells >> Constraints >> Solve.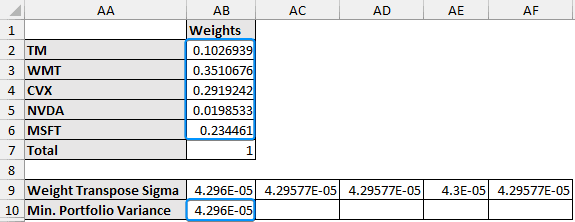
What is a Minimum Variance Portfolio?
A portfolio with the lowest volatility for a particular group of assets is known as the Minimum Variance Portfolio. It uses the covariance matrix of asset returns to assign weights that minimize the variance of the entire portfolio.
Why Use a Minimum Variance Portfolio?
➤ Uses diversification to lower portfolio risk.
➤ Only the historical return data is needed.
➤ A typical place to start in the Modern Portfolio Theory (MPT)
Making a Minimum Variance Portfolio in Excel
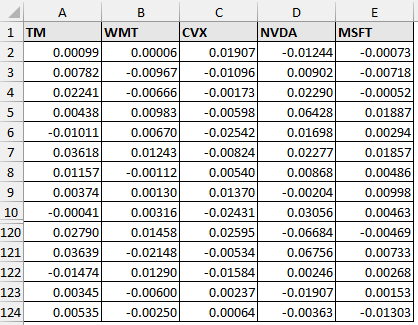
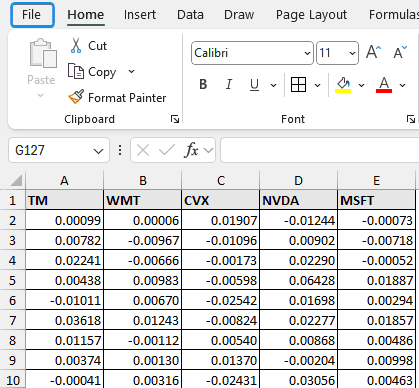
In this dataset, we have the returns from 1st January 2024 to 30th June 2024 for five stocks:
➤ Toyota Motor Corporation (TM)
➤ Walmart Inc. (WMT)
➤ Chevron Corporation (CVX)
➤ Nvidia Corporation (NVDA)
➤ Microsoft Corporation (MSFT)
There are 123 observations and the returns have been calculated from Yahoo Finance based on the adjusted close price.
Suppose you are in charge of a portfolio of these five assets and want to reduce the total volatility. To determine which weights in the portfolio produce the minimum variance, you can use Excel’s Solver Add-in to calculate the covariance matrix of returns.
Using 123 daily return observations, we’ll determine the minimum variance portfolio weights for the five assets. This method works well if you want to lower portfolio risk without depending on projected returns. For risk averse investors, it is particularly useful since it can be used as a benchmark before using strategies.
Steps:
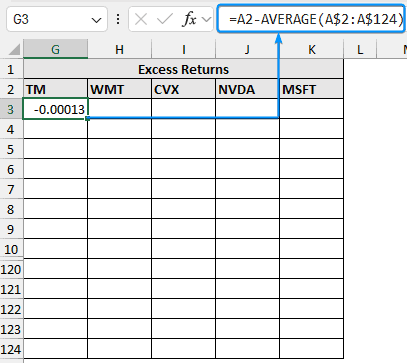
➤ Select the output cell (G3) and enter the formula. Excess return is calculated by subtracting the average returns from the firm’s return.
=A2-AVERAGE(A$2:A$124)
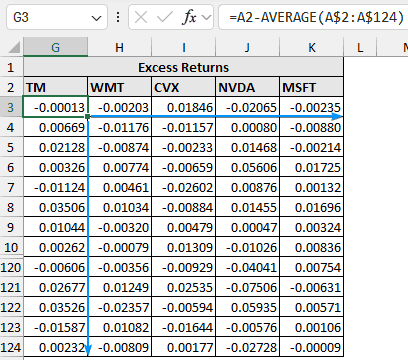
➤ Drag the Fill Handle tool to copy the formula for the rest of the columns and rows.
➤ Since there are 5 firms, select the cells for the 5 by 5 matrix >> Select all the excess returns >> Press Ctrl + Shift + Enter .
=MMULT(TRANSPOSE(G3:K124),G3:K124)
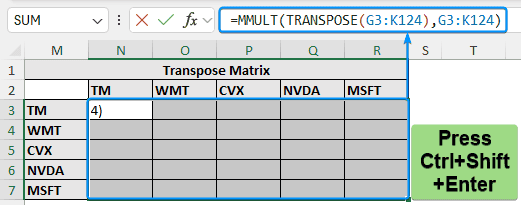
➤ You’ll get the transpose matrix. The curly braces in the formula bar indicate an array formula.
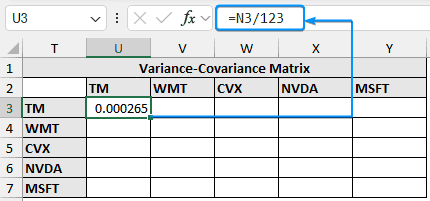
➤ To get the variance-covariance matrix divide each element of the transpose matrix with the total number of observations.
=N3/123
Or,
=N3/Count(A2:A124)

➤ Auto-fill the formula to the rest of the cells.
➤ Set the weights arbitrarily. However, the total must be equal to one.
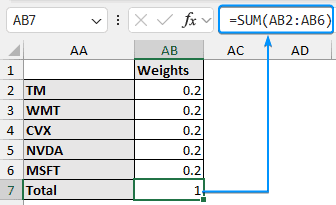
➤ Check that the total weights equal one.
=SUM(AB2:AB6)
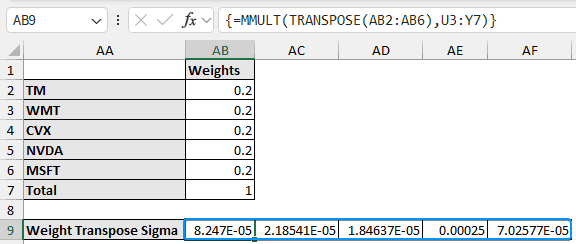
➤ Multiply the transpose of the weights with the variance-covariance matrix to get the weight transpose sigma array. Select the 5 cells, enter the formula, and press Ctrl + Shift + Enter .
=MMULT(TRANSPOSE(AB2:AB6),U3:Y7)
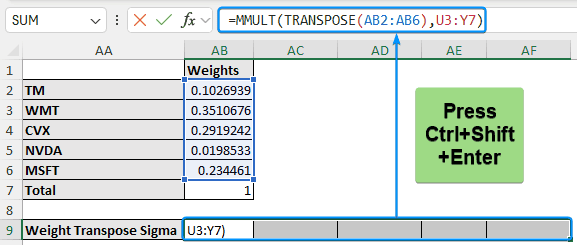
➤ The weight transpose sigma matrix is shown below.
➤ To get the portfolio variance, multiply the weight transpose sigma with the weights.
=MMULT(AB9:AF9,AB2:AB6)
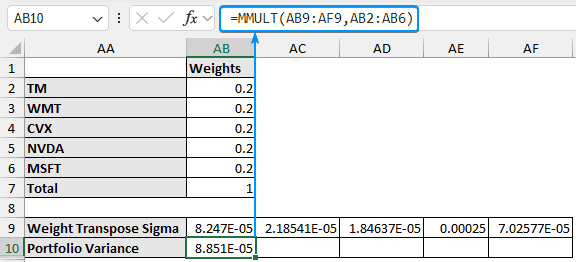
This is just a dummy portfolio variance that needs to be optimized using Excel’s Solver add-in.
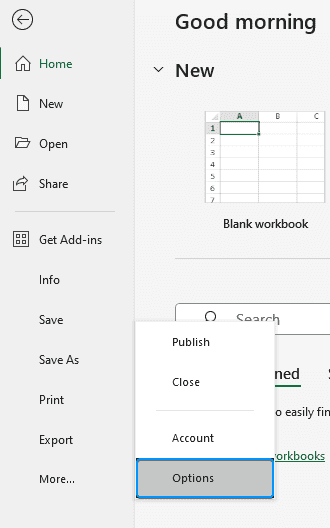
➤ Click on the File tab.
➤ Select Options. You can also use the shortcut Alt + F + T to open Excel Options.
➤ Select Add-ins >> Choose Excel Add-ins from the dropdown >> Go.
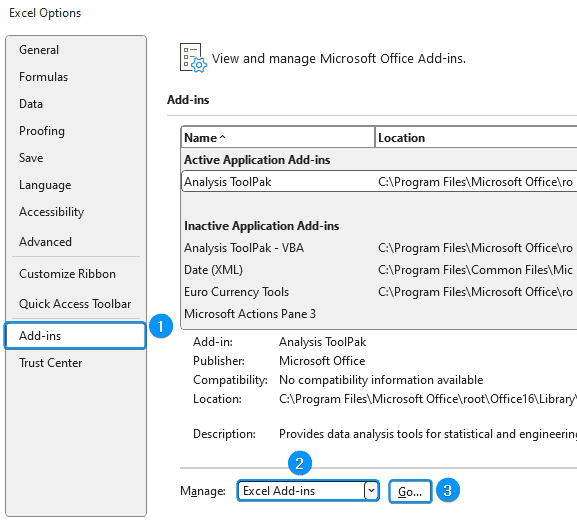
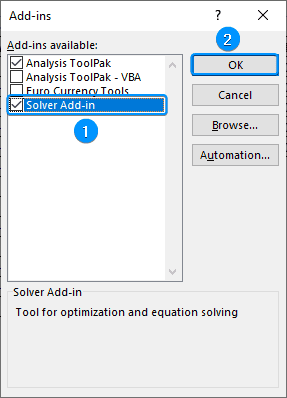
➤ Check the Solver Add-in option >> OK.
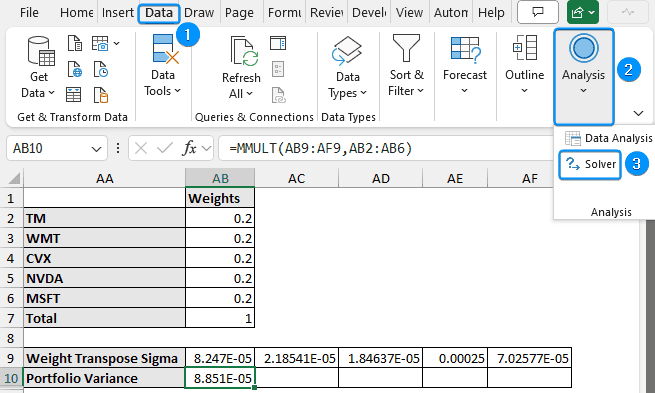
The Solver add-in will be available in the Analysis group of the Data tab, whenever you open a new workbook.
➤ Go to the Data tab >> Analysis >> Click Solver.
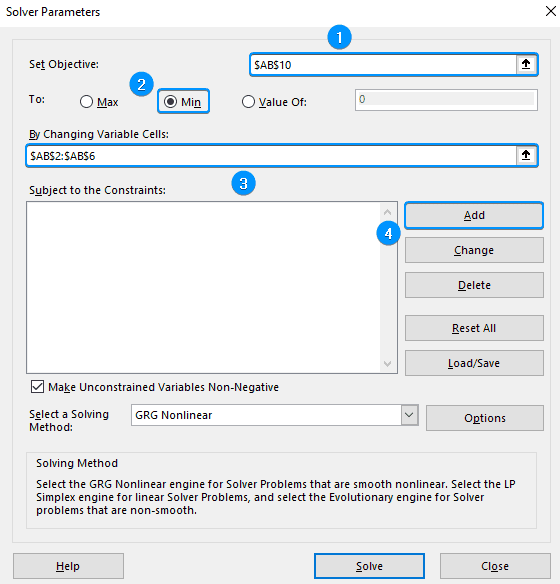
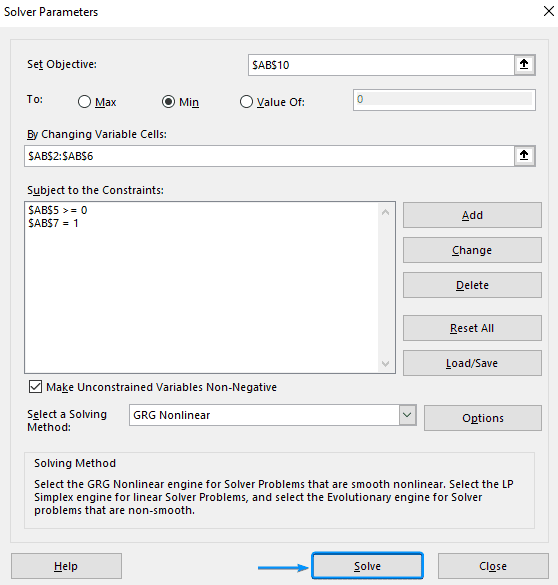
➤ For Set Objective enter the portfolio variance (AB10).
➤ Enable the Min option. We want to minimize the portfolio variance.
➤ For the By Changing Variable Cells field choose the weights (AB2:AB6).
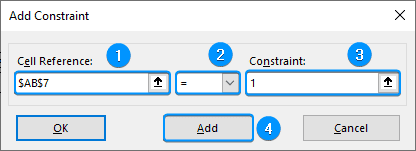
➤ Click Add to add constraints.
You can add multiple constraints. For example, we’ll add the constraints that the sum of all the weights must equal one and the weight for NVDA should be at least zero.
Other constraints include all the weights must be greater than zero or that some weights should be negative (shorting stocks).
➤ The sum of the weights equals one: Select AB7 cell >> Choose equal to >> enter 1 >> Add.
➤ The weight for NVDA should be at least zero: Select AB5 cell >> Choose greater than equal to >> Enter 0 >> OK.

➤ Check all the inputs and hit the Solve button.
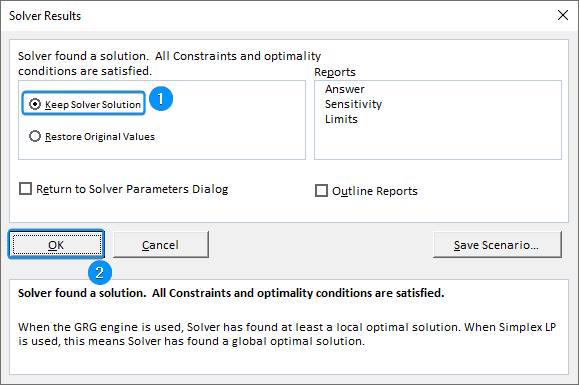
➤ Check Keep Solver Solution >> OK.
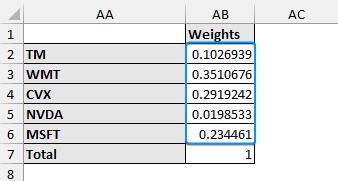
Based on the Solver results our portfolio should have the following weights for each stock:
➤ Toyota Motor Corporation: 10%
➤ Walmart Inc.: 35%
➤ Chevron Corporation: 29%
➤ Nvidia Corporation: 2%
➤ Microsoft Corporation: 23%
➤ Based on past data, these weights will return the lowest portfolio standard deviation.
➤ Note how diversification among assets with weak or negative correlations helps to lower total volatility.
➤ The minimum variance portfolio configuration can be used as a standard against which other portfolios (such as equal weighted or max Sharpe) can be compared.
FAQ
What is portfolio variance?
Portfolio variance measures the risk of a portfolio based on the variance of each asset in that portfolio.
How to minimize portfolio variance?
Portfolio variance can be minimized by selecting stocks with negative or low correlation.
What is the difference between CML and SML?
CML shows the rate of return for a certain portfolio. The risk in CML is the standard deviation of returns or the total risk.
SML indicates the market’s risk and returns at a specific point in time and the expected returns of each asset. The risk in SML is beta or systematic risk.
What is the minimum variance curve of a portfolio?
The minimum variance curve or minimum variance frontier represents a set of portfolios with the least variance (risk) for each level of expected return.
How to calculate returns from the adjusted close price?
Returns: =Next period/Previous period−1
Wrapping Up
In this tutorial, we’ve learned about the minimum variance portfolio and the steps to calculate minimum variance portfolio in Excel using the functions and the Solver add-in. Feel free to download the practice file and share your thoughts and suggestions.