
Excel Pro Tips
How to Create a Matrix in Excel (5 Different Examples)
Learn how to create a matrix in Excel using grids, SmartArt, PivotTables, bubble charts, or 4-quadrant charts for analysis and visualization.
Read article

Tasmia Rahim holds a B.Sc in Electrical Engineering with a focus on automation and embedded systems, supporting logic-driven spreadsheet workflows. With 2 years of Excel and Google Sheets experience, she works with conditional formatting and basic automation. She is interested in using macros and ActiveX controls to simplify Excel tasks and improve usability.
Articles by Tasmia Rahim are developed under the guidance of ExcelInsider’s core training program and are technically reviewed by Nehad Ulfat, lead spreadsheet consultant, to ensure accuracy and user-centric value.
Learn how to create a matrix in Excel using grids, SmartArt, PivotTables, bubble charts, or 4-quadrant charts for analysis and visualization.
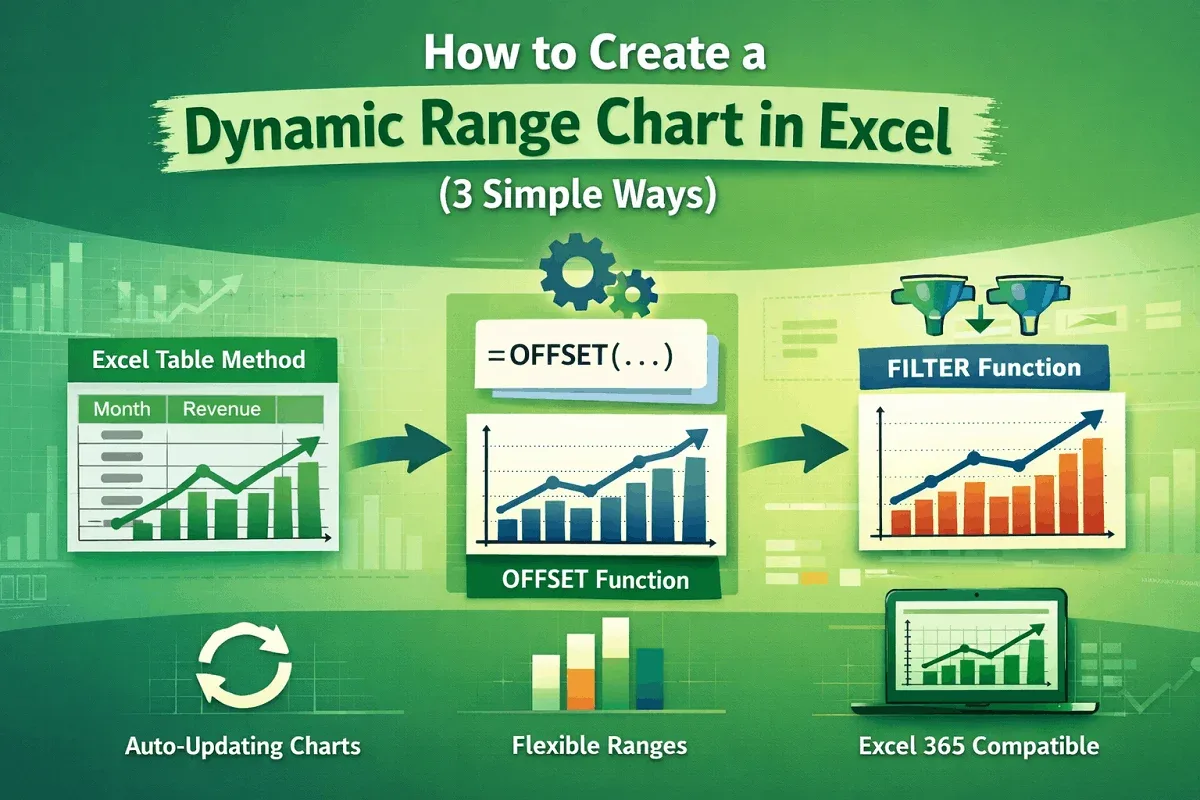
Learn how to create a dynamic range chart in Excel using tables, OFFSET with named ranges, or FILTER with dynamic arrays in Excel 365.
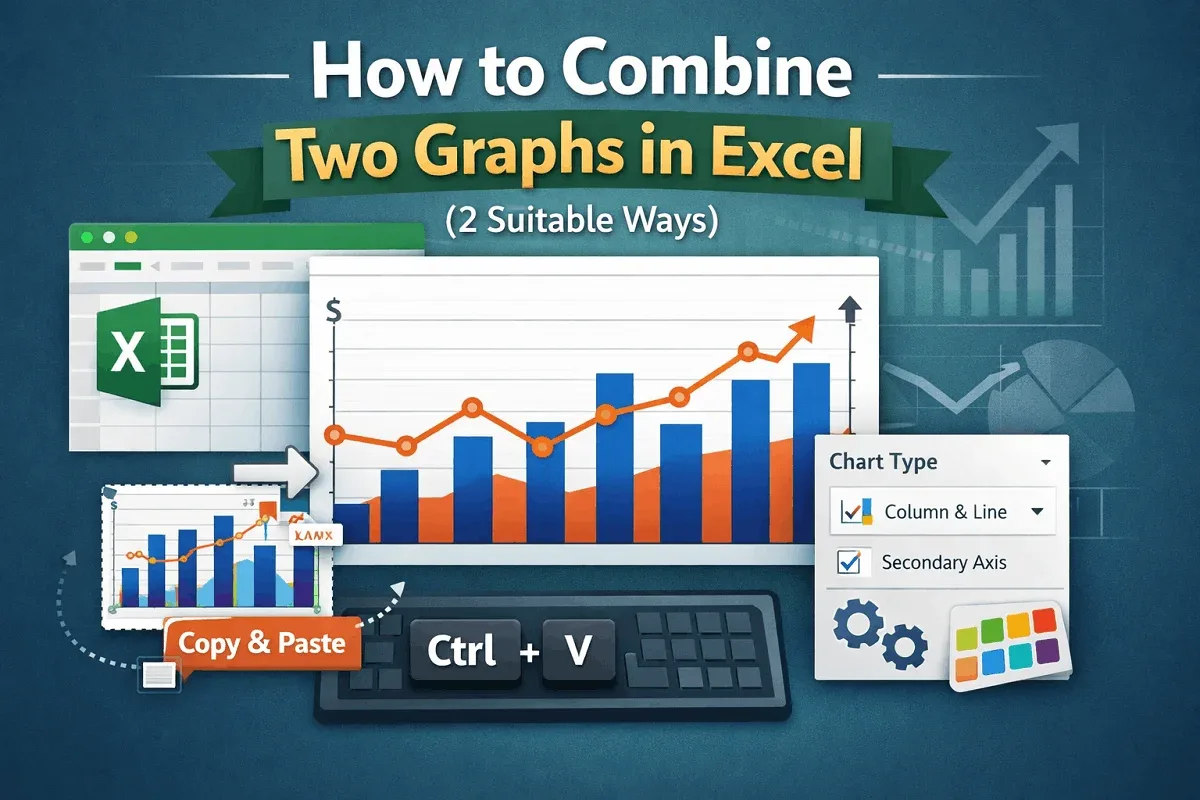
Learn how to combine two graphs in Excel using the Combo Chart tool to overlay data or by manually merging charts with a simple copy-paste.
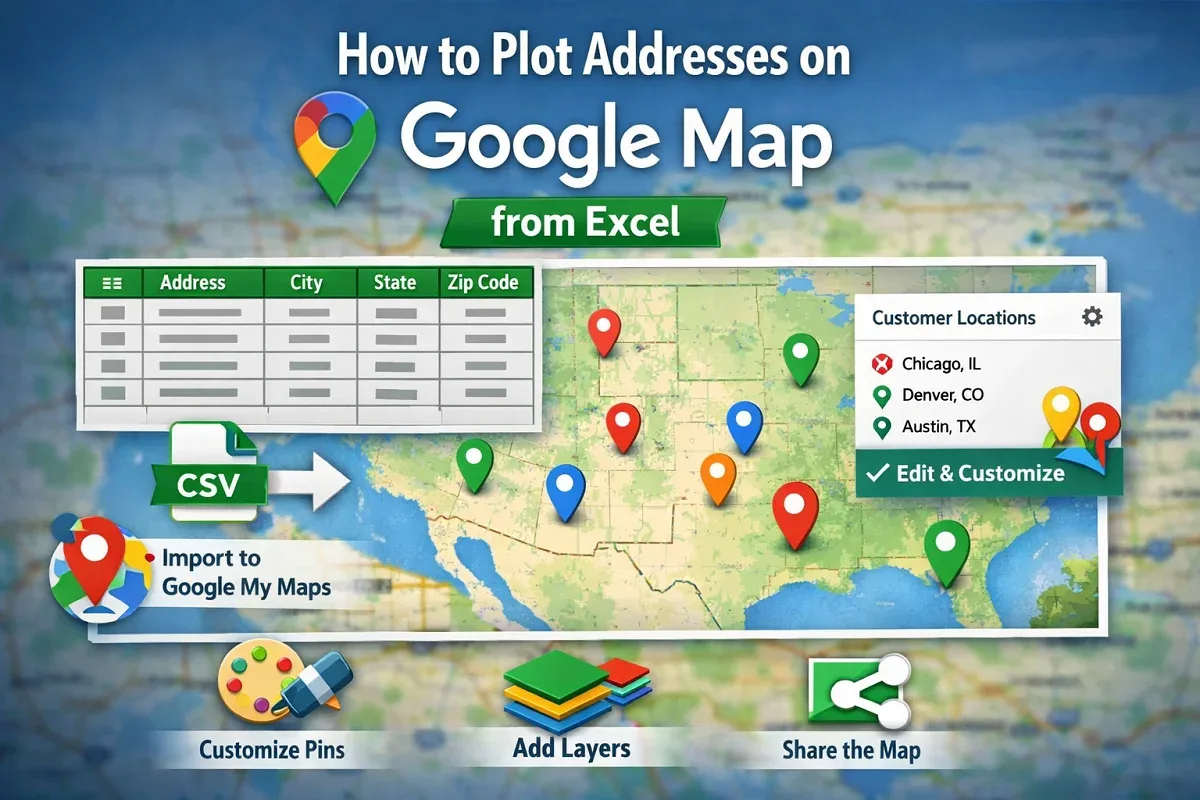
Learn how to plot addresses on Google Maps from Excel by preparing data, importing it into Google My Maps, and customizing labels & styles.
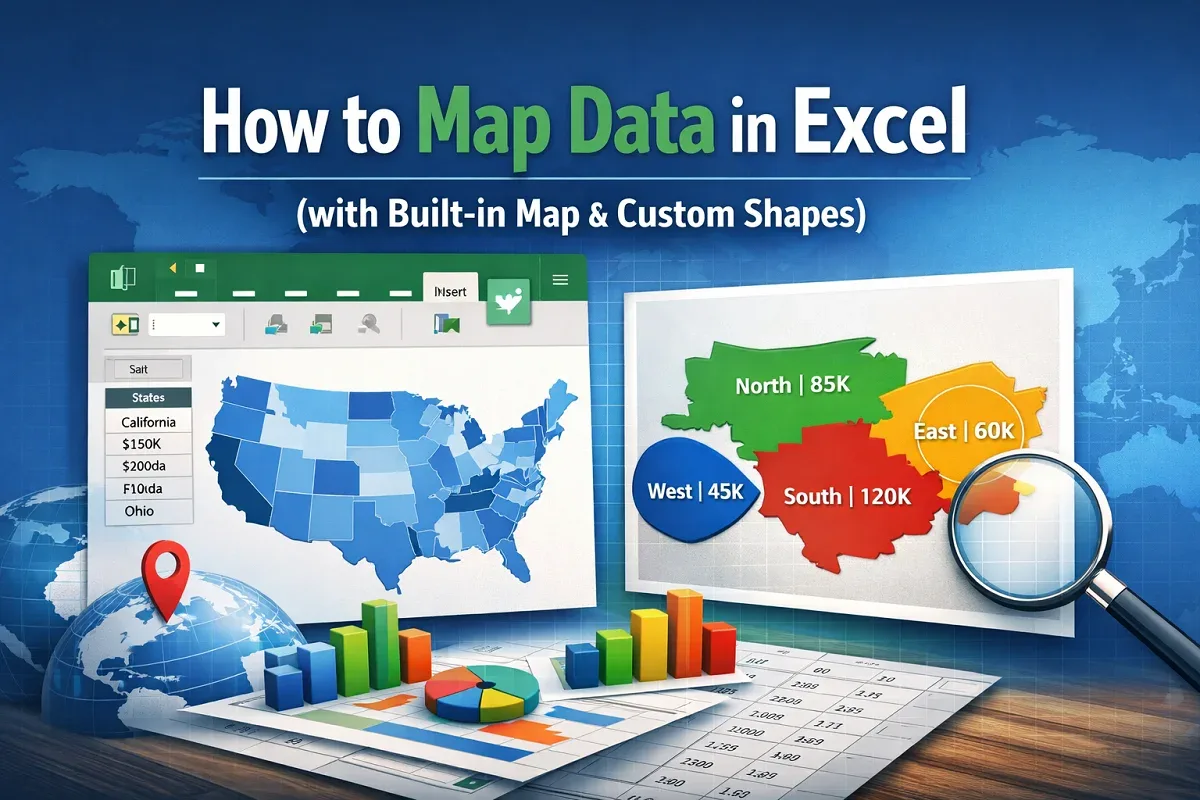
Learn how to map data in Excel using the built-in map chart feature or by creating a custom visual map manually for geographic insights.
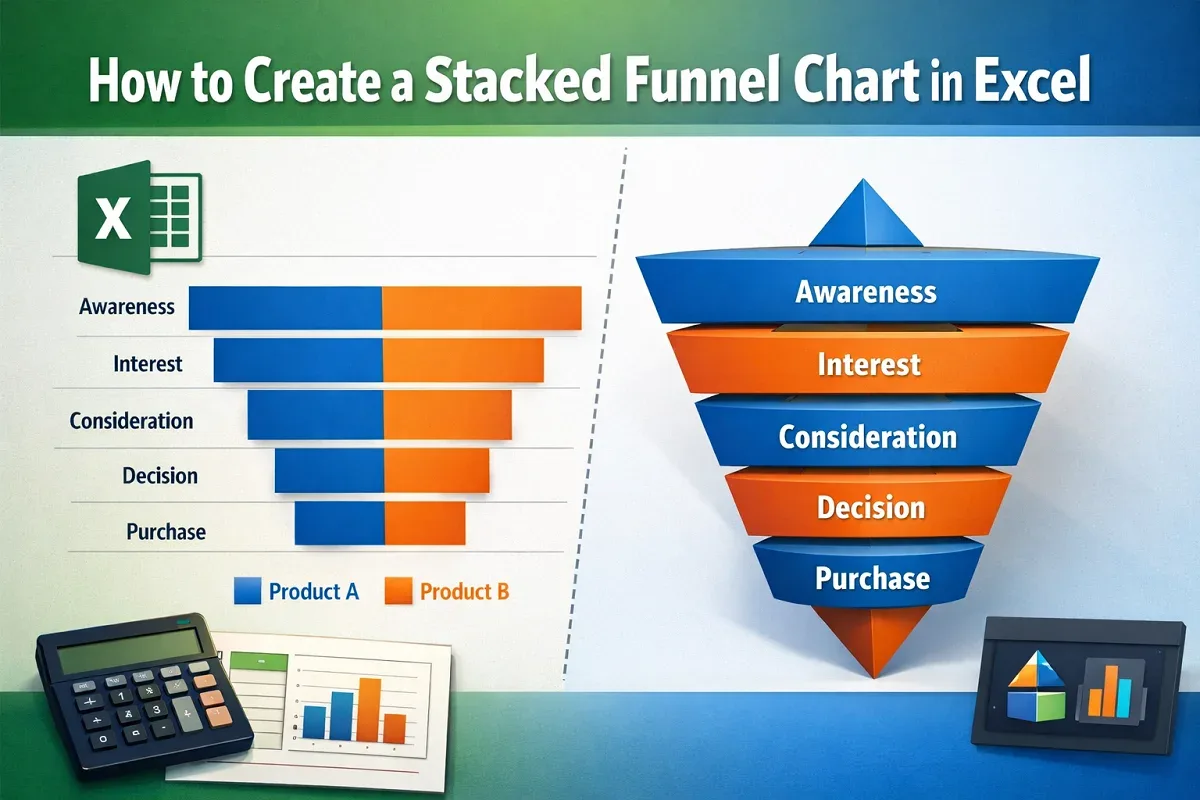
Learn how to create a stacked funnel chart in Excel, including horizontal stacked funnels and 3D pyramid-style charts.
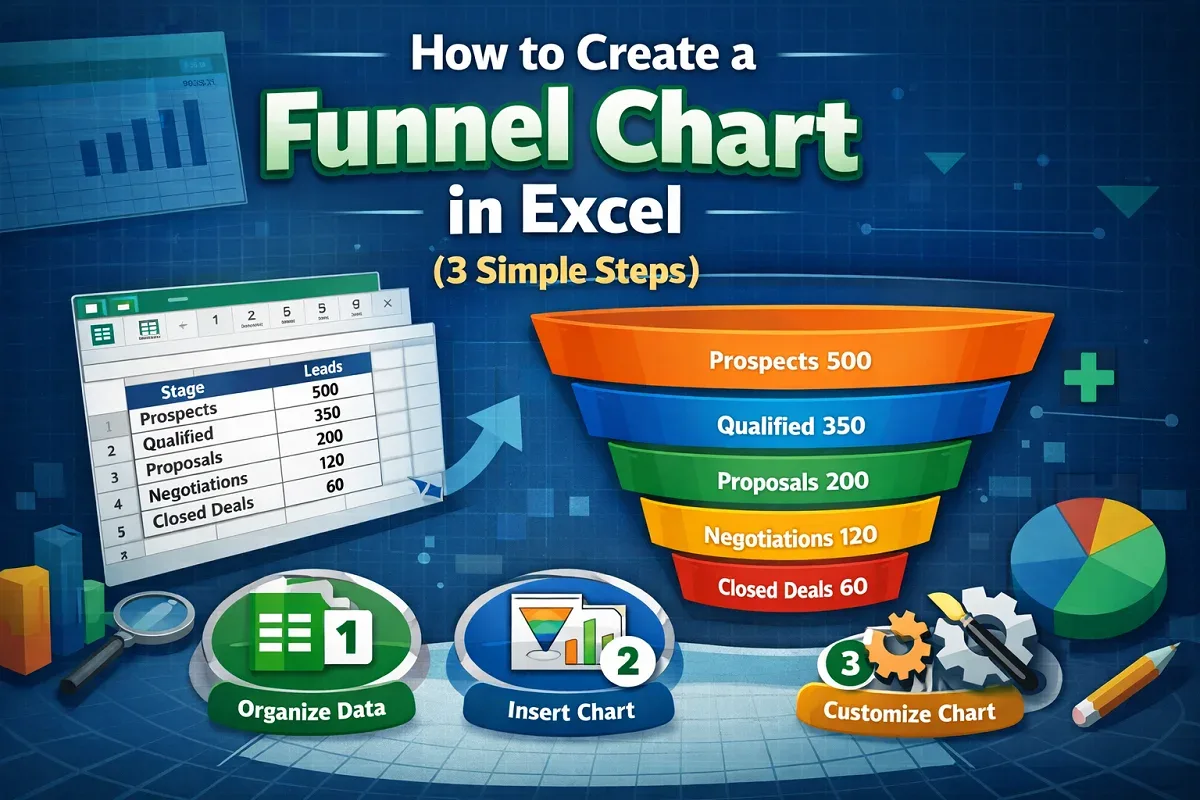
Learn how to create a funnel chart in Excel by selecting your dataset, inserting the chart, and customizing it for clear data visualization.
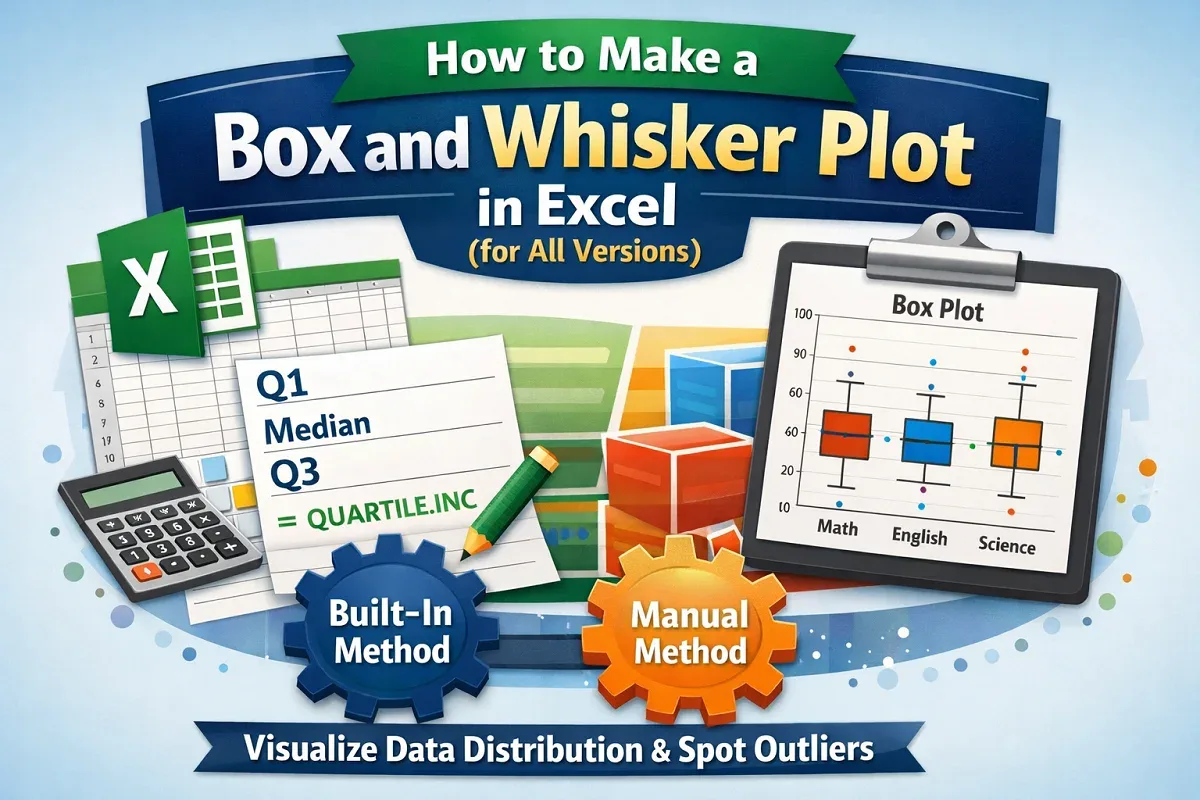
Learn how to make a box and whisker plot in Excel using the built-in chart feature in newer versions or by creating one manually.
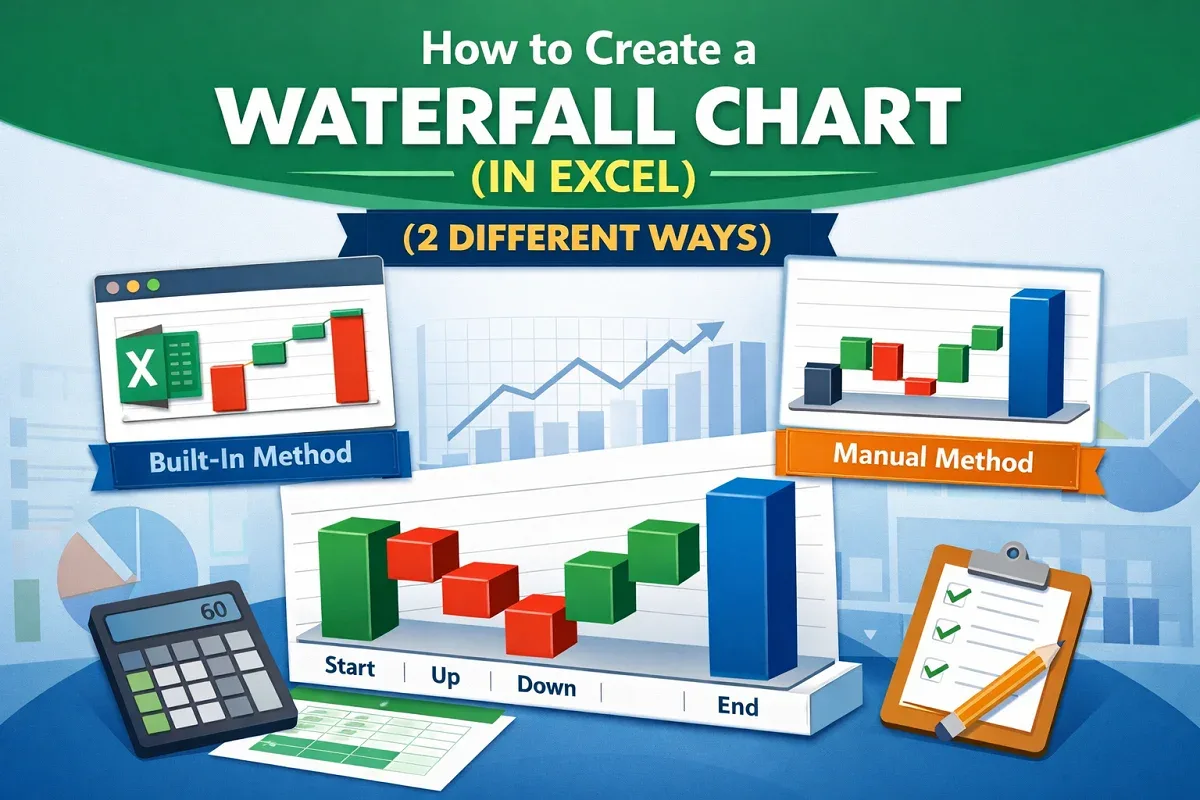
Learn how to create a waterfall chart in Excel using the built-in feature in newer versions or by manually building
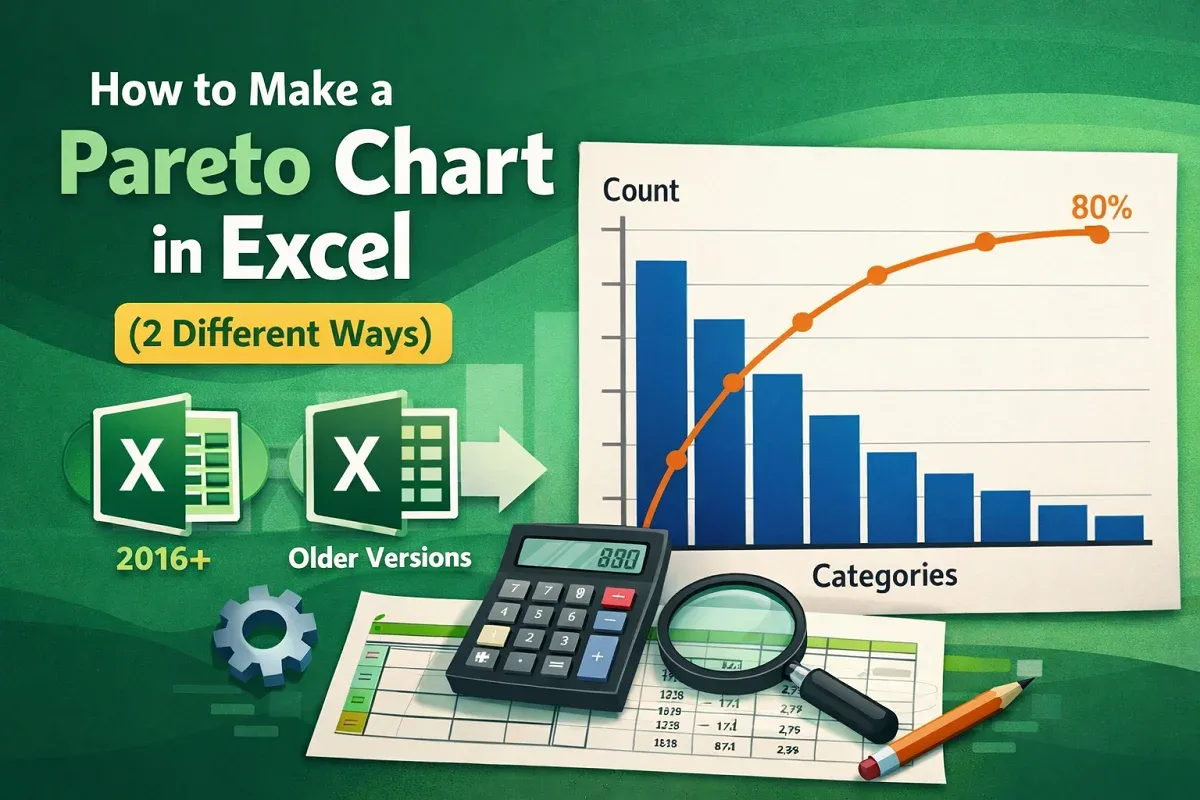
Learn how to make a Pareto chart in Excel using the built-in tool in newer versions or by manually creating one in older Excel versions.
![[Fixed] Histogram Bin Range Not Working in Excel](https://pub-b39c974f4c124a36a2fb517be38076ec.r2.dev/images/2026/08/featured-image-excel-histogram-bin-range-not-working-2-61a2aa04.webp)
Fix the “Histogram bin range not working” issue in Excel by using correct formats, clearing errors or, adjusting axis settings.
Learn how to create a bin range in Excel using the Histogram tool, built-in histogram charts, or the FREQUENCY function for data grouping.