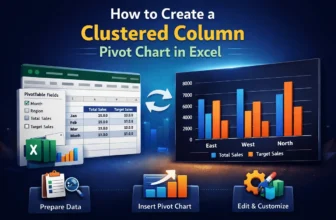
Visualizing data is crucial for better analysis, and a clustered column Pivot Chart is one of the best charts for it. It is a type of bar chart that displays data in vertical columns, where related ...
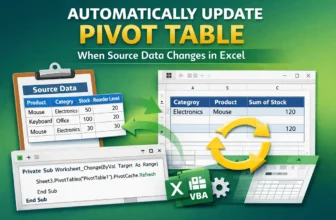
When working with PivotTables in Excel, you may need to change the source data. But after changing the source data, you might forget to refresh or update it. This will lead to errors and wrong ...
Pivot Tables are one of the best tools for summarizing and analyzing data. However, when applying conditional formatting, blank cells get formatted. This can be visually distracting and misleading. ...
Blank cells within an Excel Pivot Table often occur when there is no data entry for a specific row and column labels. These blanks can make data analysis and reporting confusing. Fortunately, Excel ...
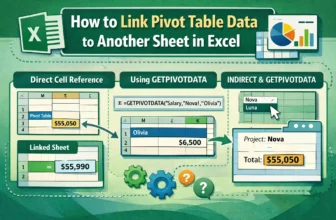
Pivot Tables are used for summarizing and analyzing vast amounts of data in Excel. However, the summarized results often need to be presented on a separate sheet for further analysis. Linking a Pivot ...
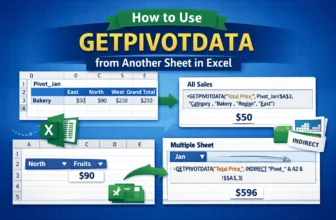
Pivot Tables are used for summarizing large datasets, but often, the summarized data needs to be pulled into a different sheet for analysis. Excel’s built-in GETPIVOTDATA function is designed to ...
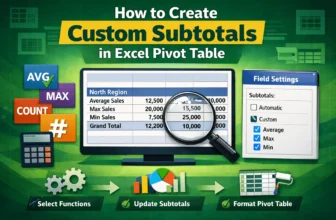
Pivot Tables are one of the tools used in Excel for summarizing large datasets. By default, Pivot Tables provide a Sum as the subtotal for each group. However, for more versatile analysis, you might ...
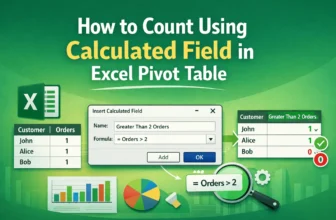
Pivot Tables focus on summarizing data in Excel. While they provide standard aggregation methods like Sum and Count, sometimes you need a more advanced calculation, such as a conditional count or a ...
Pivot Tables are used for summarizing large datasets in Excel. While displaying the sum of values is standard, calculating the percentage of the grand total is crucial to show the contribution of ...