A Pivot Table is a great feature for analyzing and summarizing complex data. However, when you add multiple fields to the Rows area, Excel automatically nests them, creating a complex structure that ...
For summarizing large datasets, a Pivot Table is a handy tool. However, a common problem is how to update a Pivot Table when new rows of data are added to the source. Manually creating a new Pivot ...
A Pivot Table is a tool for summarizing and analyzing data, but its default orientation might not always fit your needs. Transposing a Pivot Table allows you to swap its rows and columns, providing a ...
After creating a Pivot Table, you might need to add more data to your source sheet. Often, you will notice that your newly added data is not reflected in the Pivot Table. This problem often occurs ...
Have you ever faced the frustrating "Data source reference is not valid" error when trying to use a PivotTable in Excel? It typically happens when Excel can't find or access the data source that the ...
Pivot Tables are one of Excel's most useful features for summarizing and analyzing large datasets. However, manually creating them can become repetitive, especially if you need to generate the same ...
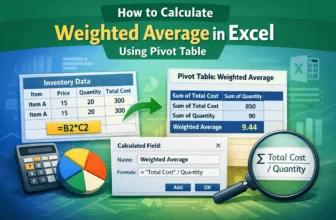
In accounting, the weighted average is often used for inventory calculations. Instead of the normal average, weighted averages sometimes provide a better picture of the data for various statistical ...
Dividing the sum by the count is one of the most used calculations in the area of mathematics. Suppose you have the sum of the money spent on buying something, and the number of items you purchased. ...
Formulas using if statements help us use conditions to format our data. Imagine you have a salary sheet where you determine the bonus depending on whether the employee has worked more than a certain ...