While working with data in Excel, you will frequently need to estimate values between two known points. Interpolation is useful in this situation. This article explores linear interpolation and uses real world dataset to demonstrate how to interpolate between two values in Excel. Whether you’re working with website traffic, sales reports, or research data, this guide will help you learn linear interpolation so that you can perform forecasting, evaluate trends, fill in gaps, and much more.
➤ Interpolation estimates a value between two known values. In this article, we’ll learn about interpolation and three ways to interpolate between two values in Excel using the arithmetic formula and Excel FORECAST or FORECAST.LINEAR function. In addition, we’ll explore inner interpolation.
➤ Formula: y =y1 + (x - x1) * (y2 - y1) / (x2 - x1)
➤ Function 1: =FORECAST.LINEAR(x,known_ys,known_xs)
➤ Function 2: =FORECAST(x,known_ys,known_xs)
➤ Inner linear interpolation: =FORECAST.LINEAR(x,INDEX(known_ys,MATCH(x,known_xs,1)):INDEX(known_ys,MATCH(x,known_xs,1)+1),INDEX(known_xs,MATCH(x,known_xs,1)):INDEX(known_xs,MATCH(x,known_xs,1)+1))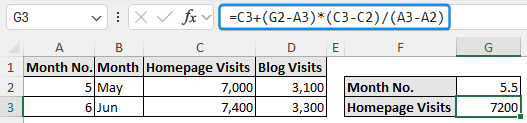
What is Interpolation?
Interpolation is a process of estimating unknown values between two known values. Linear interpolation is the most widely used type of interpolation, assuming a straight line relationship between the two known points. In addition, there are also non linear interpolation, assuming a non linear relationship between the known points.
Using Arithmetic Formula to Interpolate between Two Values
Consider the website activity data with the month number, month, homepage visits, and blog visits columns.
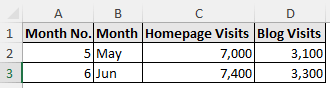
Here we have the data for May and June. Suppose you want to compare the number of homepage and blog visits on May 15, during which time a promotional campaign was conducted. You can interpolate using the data for May and June.
The arithmetic formula for linear interpolation is given below.
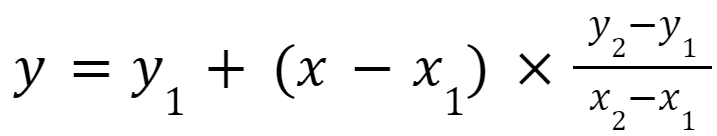
where
➤ x: value to interpolate
➤ x1 and x2: known values of x
➤ y1 and y2: known values of y
Steps:
➤ The month numbers corresponding to May and June are 5 and 6, respectively. For the middle of May and June, the month number will be 5.5.
➤ To calculate the homepage visits, let’s break down what x, x1, x2, y1, and y2 each represent.
- x is the middle of May and June (5.5)
- x1 and x2 are the 5 and 6 for May and June
- y1 and y2 are 7000 and 7400 homepage visits in May and June
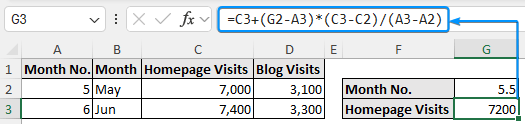
➤ Enter the formula in the output cell G3.
=C3+(G2-A3)*(C3-C2)/(A3-A2)
Interpolating between Two Values with FORECAST.LINEAR Function
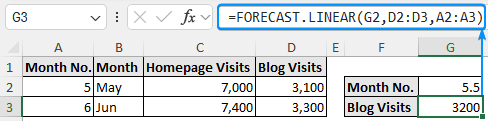
You can interpolate between two values in Excel with the FORECAST.LINEAR function. This approach is suitable for time series data with a straight line relationship between two known data points. As a continuation of the previous discussion, let’s use the FORECAST.LINEAR function to estimate the blog visits during the promotional campaign, halfway between May and June.
Steps:
➤ Select the output cell (G3) and type the FORECAST or FORECAST.LINEAR function.
➤ A breakdown of the arguments
- G2 is the middle of May and June (5.5)
- D2:D3 contains the blog visits (3,100 and 3,300) in May and June
- A2:A3 represents the month numbers 5 and 6 for May and June
=FORECAST.LINEAR(G2,D2:D3,A2:A3)
Performing Inner Linear Interpolation between Two Values
The 12 month website activity dataset contains the month no., month, homepage visits, blog visits, product page visits, and checkout visits from columns A through F.
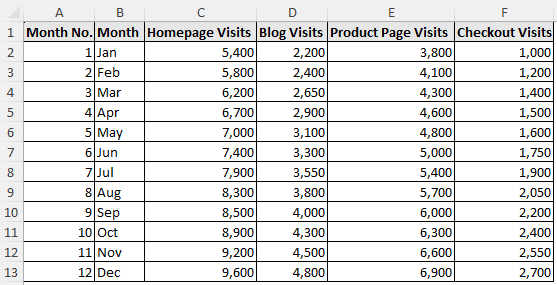
Let’s say you want to estimate product page visits for October 15. The entire months of October (6,300 visits) and November (6,600 visits) are covered by your data. You can use a straightforward formula to interpolate, as October 15 is halfway between the two months.
As covered in the previous methods, we could do this manually, but Excel functions can make the process more flexible.
Using XLOOKUP Function to Perform Interpolation
The XLOOKUP function can look up the two pairs of x and y values from the table in a dynamic way. Afterward, we can use the arithmetic formula or the FORECAST.LINEAR function to interpolate the number of visits.
Steps:
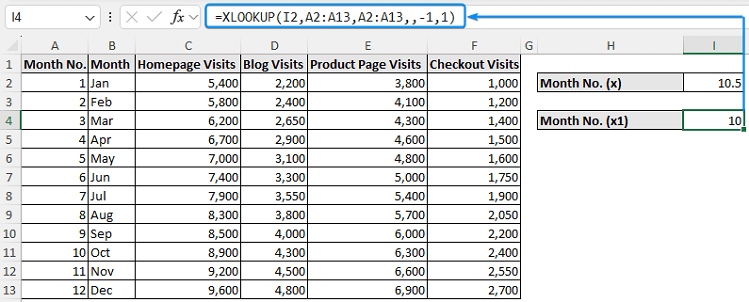
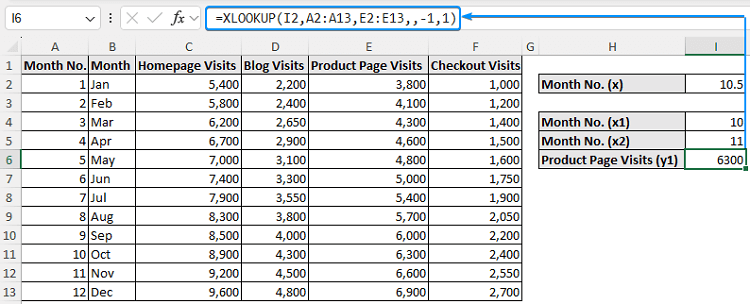
➤ Move to cell I4 and enter the formula to look up the upper value (x1).
=XLOOKUP(I2,A2:A13,A2:A13,,-1,1)
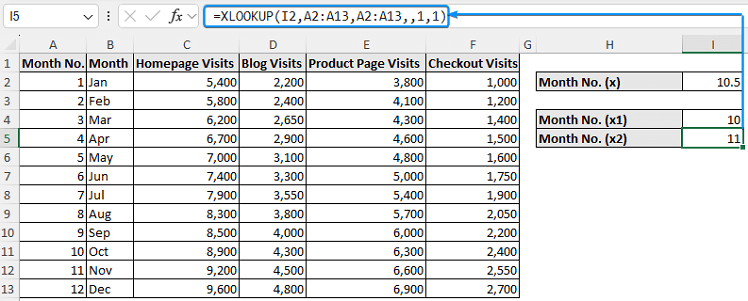
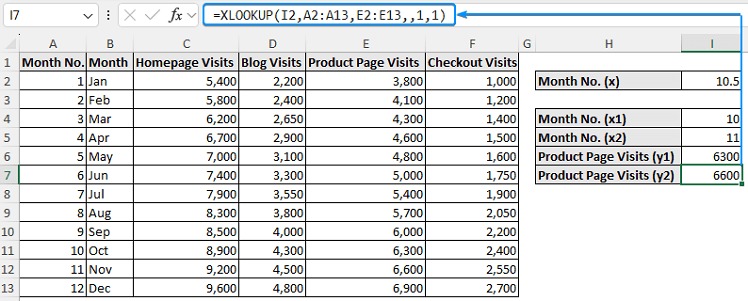
➤ For lower value (x2) just replace the -1 in the formula with 1.
=XLOOKUP(I2,A2:A13,A2:A13,,1,1)
➤ Again look up the upper value (y1) by adjusting the return array in the formula.
=XLOOKUP(I2,A2:A13,E2:E13,,-1,1)
➤ Extract the lower value (y2) with the formula below.
=XLOOKUP(I2,A2:A13,E2:E13,,1,1)
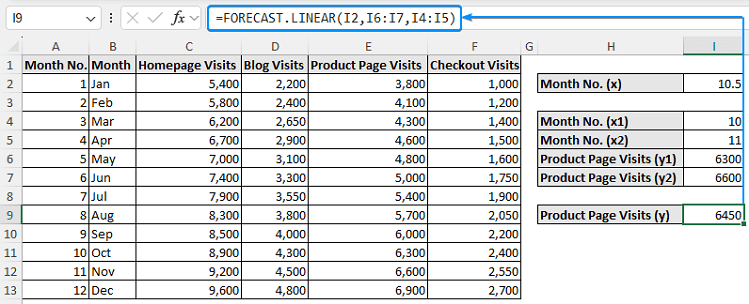
➤ Perform linear interpolation with the FORECAST or FORECAST.LINEAR function.
=FORECAST.LINEAR(I2,I6:I7,I4:I5)
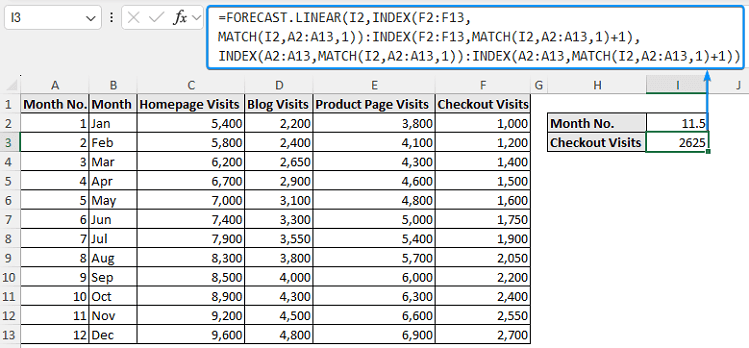
Using INDEX-MATCH Functions to Interpolate between Two Values
If you’re using an earlier version of Excel, you can nest the INDEX and MATCH functions inside the FORECAST.LINEAR function to directly get the result.
Steps:
➤ Move to the output cell (E3) and enter the formula.
=FORECAST.LINEAR(I2,INDEX(F2:F13,MATCH(I2,A2:A13,1)):INDEX(F2:F13,MATCH(I2,A2:A13,1)+1),INDEX(A2:A13,MATCH(I2,A2:A13,1)):INDEX(A2:A13,MATCH(I2,A2:A13,1)+1))
➤ Homepage Visits: 7,200
➤ Blog Visits: 3,200
➤ Product Page Visits: 6,450
➤ Checkout Visits: 2,650
The use of linear interpolation is supported by these estimates, which display a consistent positive growth between months.
FAQ
What is data interpolation?
Interpolation estimates unknown values that fall within known data points.
How to interpolate between two points in Excel?
=FORECAST.LINEAR(x,known_ys,known_xs) or,
=FORECAST(x,known_ys,known_xs)
What is the interpolation formula?
Formula for interpolation, y =y1 + (x - x1) * (y2 - y1) / (x2 - x1)
How do you fill data between two points in Excel?
➤ Select the range including the top and bottom values.
➤ Press the Alt + H + F + I + S keys to open Fill Series and hit OK.
How to perform non linear interpolation?
If your data shows a non linear trend, you may use polynomial or spline interpolation.
What is the difference between Interpolation vs. Extrapolation?
Using interpolation, values inside known data points are estimated. Extrapolation involves making estimates for values that fall beyond the data range (e.g., predicting visitor numbers for next month).
What if the intervals between known values are non uniform?
Interpolation still works as long as the boundary values are known.
Wrapping Up
In this tutorial, we’ve learned how to interpolate between two values in Excel using arithmetic formula and FORECAST.LINEAR function. In addition, we have also covered inner interpolation. Feel free to download the practice file and share your thoughts and suggestions.