Outliers can distort your data and lead to inaccurate results. This article will teach you how to calculate outliers in Excel and help you deal with outliers. Whether you’re analysing website traffic, examining sales, or student test results, identifying outliers helps you enhance accuracy and clean up your data.
➤ Outliers lie far apart from the majority of data points. In this article, we’ll learn about outliers and three methods to calculate outliers in Excel. We’ll explore the interquartile range method, use standard deviation to determine outliers, and apply Excel charts to visualize and detect outliers.
➤ IQR method:=QUARTILE.INC(array,1)=QUARTILE.INC(array,3)=Q3-Q1=Q1-1.5*IQR=Q3+1.5*IQR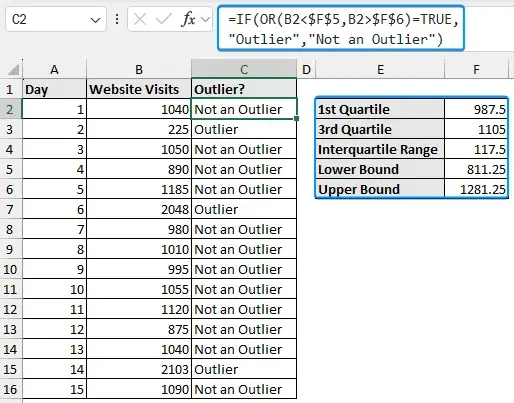
What is an Outlier in Statistics?
Outliers differ significantly from the rest of the points in a dataset. They lie far outside the range of values and are caused by variations in data, errors in measurement, or unusual events.
Outliers can distort and affect data analyses, so identifying them ensures accurate results and better decision making.
Using Interquartile Range to Determine Outliers
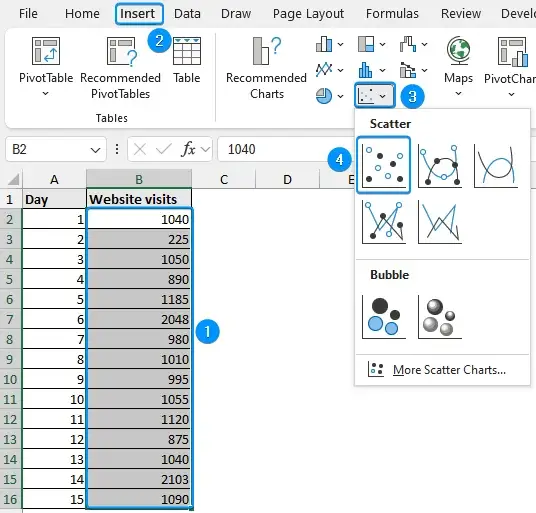
In this dataset, we have the daily website visits for an e-commerce site over 15 days.
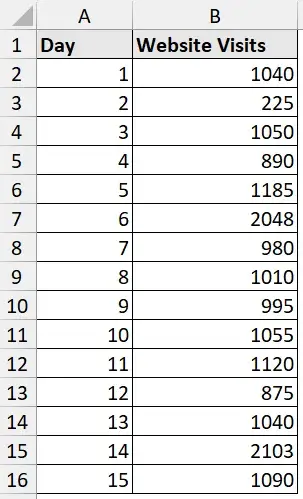
The website traffic is unusually low on day 2, while it’s significantly high on days 6 and 14. Let’s use Excel to determine if they are outliers, and are there more of them?
Steps:
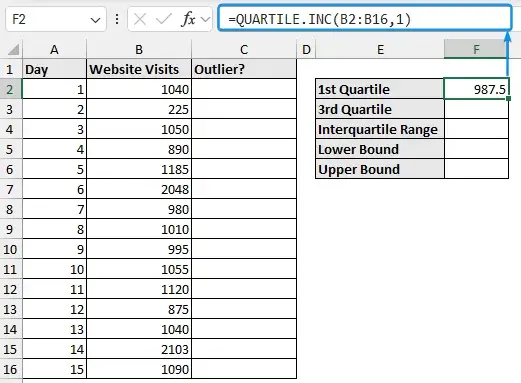
➤ Select the output cell (F2) and use the formula to calculate the first quartile.
=QUARTILE.INC(B2:B16,1)
➤ Again use the QUARTILE.INC function to calculate the third quartile.
=QUARTILE.INC(B2:B16,3)

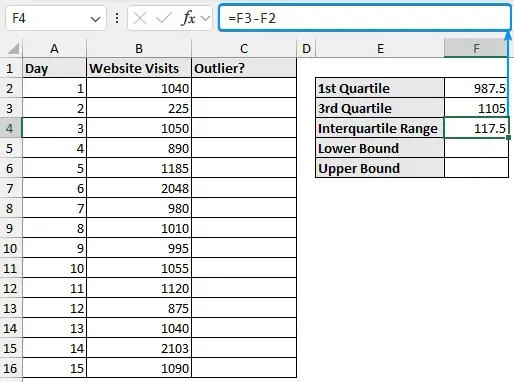
➤ Subtract the first quartile from the third quartile to get the interquartile range.
=F3-F2
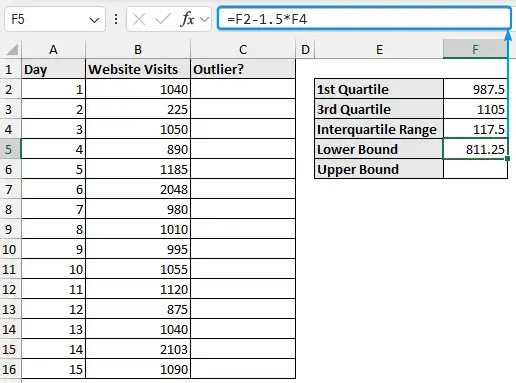
➤ Calculate the lower bound. Any data point below the lower bound is an outlier.
=F2-1.5*F4
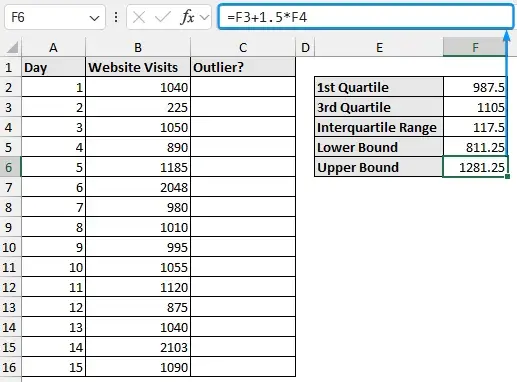
➤ Again, obtain the upper bound. Any data point above the upper bound is an outlier.
=F3+1.5*F4
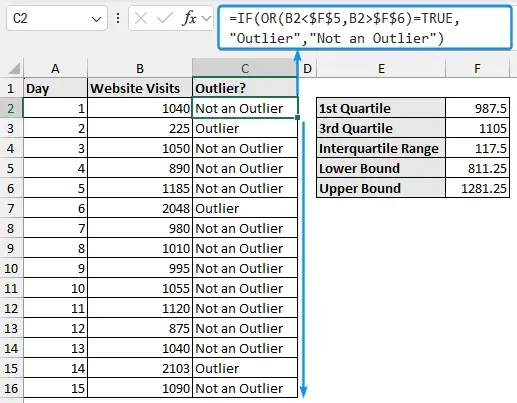
➤ Based on the lower and upper bounds, determine which observations are outliers.
=IF(OR(B2<$F$5,B2>$F$6)=TRUE,"Outlier","Not an Outlier")
➤ In the Home tab, go to Sort & Filter >> Click the Filter option.
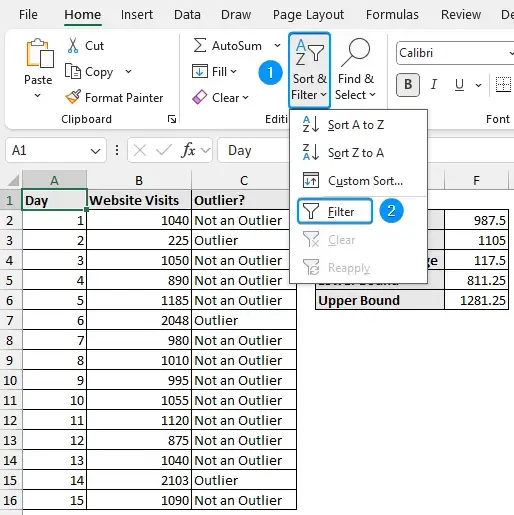
➤ Click the drop-down arrow >> Check outlier >> OK.

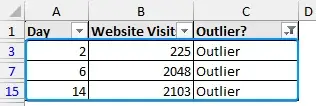
The three outliers have been filtered out from the dataset. Learn to deal with outliers in the Handling Outliers section of this blog.
Calculating Outliers with Standard Deviation
Another way to calculate outliers in Excel is with the STDEV.S function, which gives the sample standard deviation.
Steps:
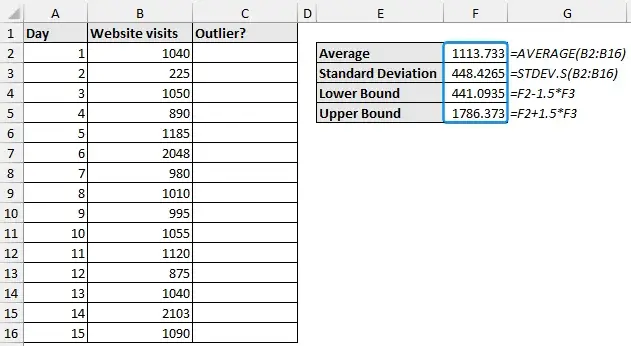
➤ Calculate the following measures with the formulas given below:
Average:
=AVERAGE(B2:B16)
Sample standard deviation:
=STDEV.S(B2:B16)
Lower bound:
=F2-1.5*F3
Upper bound:
=F2+1.5*F3
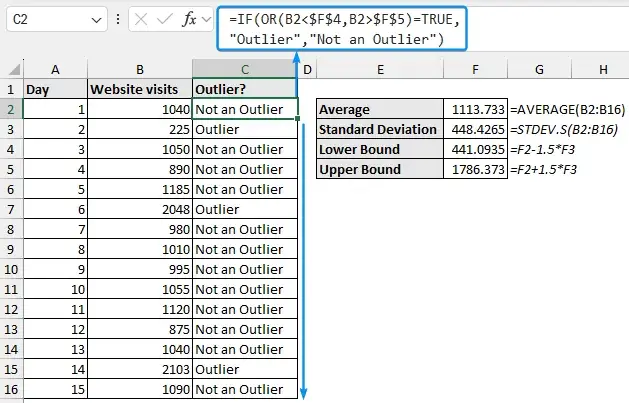
➤ Find the outliers using the lower and upper bounds.
=IF(OR(B2<$F$4,B2>$F$5)=TRUE,"Outlier","Not an Outlier")
You may use the Filter option to filter out the outliers as shown earlier.
Identifying Outliers with Excel Charts
You can visually identify outliers with box plots, histograms, and scatter plots.
Box Plot
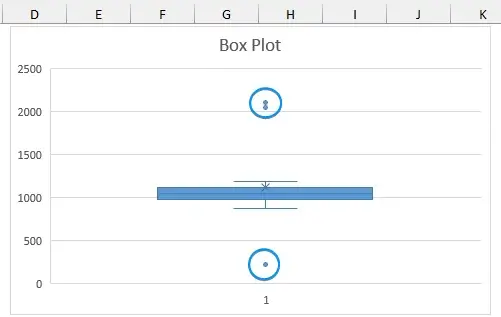
Box plots display outliers as dots. Any point above and below the whiskers is an outlier.
Steps:
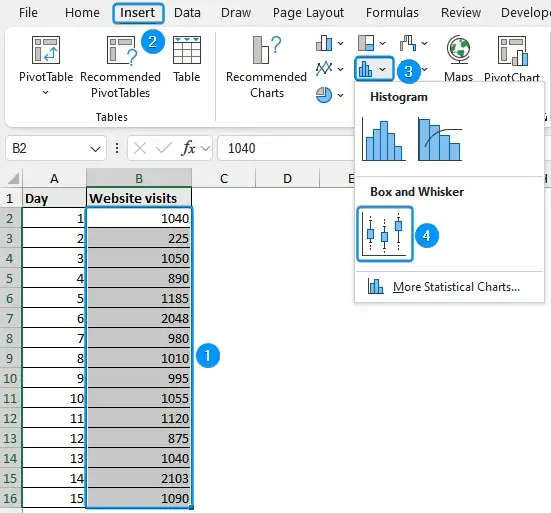
➤ Select the data (B2:B16) >> Insert >> Statistic Chart >> Box and Whisker.
➤ The three outliers (circled) are shown in the box plot.
Histogram
Histograms show outliers as isolated bars far apart from the rest of the bars.
Steps:
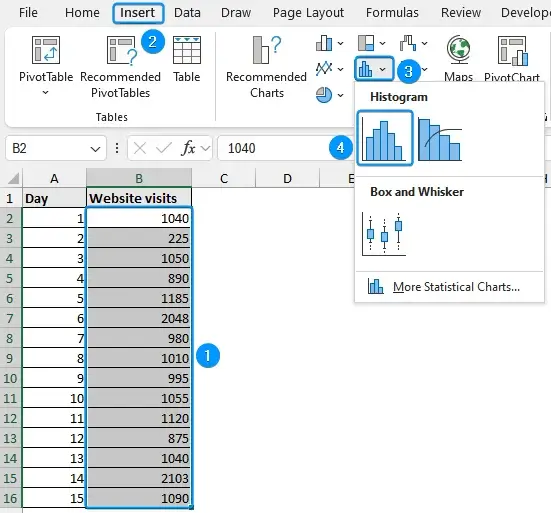
➤ Select the data range >> Insert >> Statistic Chart >> Histogram.
➤ Double-click the horizontal axis >> Axis Options >> Set the number of bins (6).
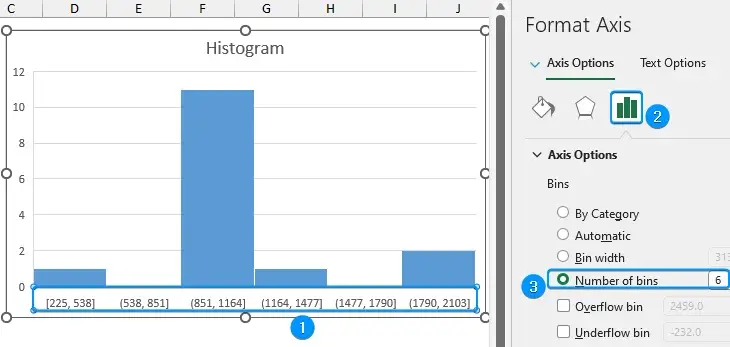
The two outliers are located to the right while the other outlier is to the left.
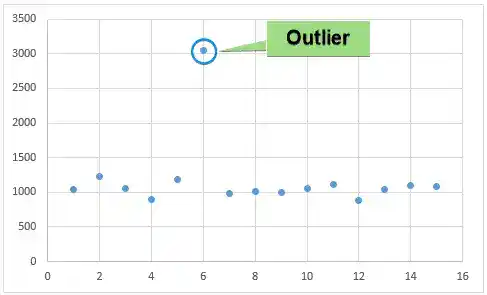
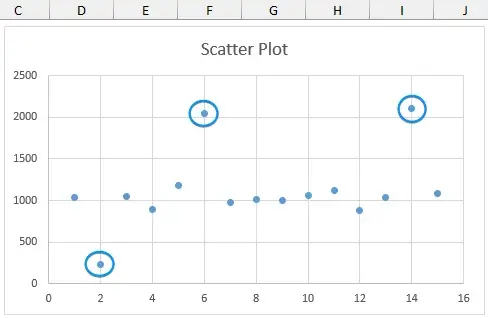
Scatter Plot
Scatter plots show a trend where most of the observations fall. Outliers do not fit this trend and are far apart from the other points.
Steps:
➤ Select the data >> Insert >> Scatter or Bubble Chart >> Scatter.
➤ The outliers are circled and appear far apart from the rest of the observations.
Handling Outliers
➤ Deleting outliers: You can delete outliers or use the Filter option for large datasets. It’s advisable to keep a copy of the original data with outliers before deleting them.
➤ Replacing outliers: You can replace outliers instead of deleting them.
- Transformation: Use natural log, take square root, etc. to reduce distortion.
- Truncation: Set a range and replace outliers (above or below) with a certain value within this range.
➤ Keeping outliers: Instead of deleting or replacing outliers, you can analyze them to draw insights and their causes. For example, a sudden drop in website traffic may indicate technical issues like slow loading of the website. In contrast, a sudden rise in traffic may indicate festivities, social events, etc.
FAQ
What is the formula for calculating outliers?
Any value below the lower bound or greater than the upper bound is an outlier.
➤ Lower bound: =Q1-1.5*IQR
➤ Upper bound: =Q3+1.5*IQR
What is an outlier in an Excel box plot?
Any point outside (above or below) the whisker is an outlier.
How to identify outliers in an Excel scatter plot?
Any data point isolated from the majority of data points is an outlier.
How to use z-score to find outliers in Excel?
Calculate the Z score of each data point, z: =(value - mean)/standard deviation
Any data point with a Z score greater than 3 is an outlier.
How to remove outliers?
You can insert a Filter Ctrl+Shift+L to remove out the outliers.
Wrapping Up
In this tutorial, we’ve learned about outliers and how to calculate outliers using interquartile range and standard deviation. We’ve also learned to identify outliers visually with Excel charts. Feel free to download the practice file and let us know your preferred method.