A binomial distribution summarizes the number of successes in a fixed number of independent and identical trials. You can calculate binomial probability using a built-in Excel function.
➤ A binomial distribution summarizes the number of successes in a fixed number of independent and identical trials.
➤ Each trial has two possible outcomes: success (p) or failure (1-p).
➤ Probability mass function: =BINOM.DIST(number_s, trials, probability_s, FALSE)
➤ Cumulative distribution function: =BINOM.DIST(number_s, trials, probability_s, TRUE)
➤ Use the probability mass argument when calculating a certain (x) amount of success.
➤ Use the cumulative distribution argument when calculating (x) or fewer successes.

In this article, we’ll learn about binomial distribution and how to calculate binomial probability for equal to a number, at least or at most a number, and more than or less than a number. We’ll use the BINOM.DIST function in Excel. For earlier versions of Excel, use the BINOMDIST function.
What is Binomial Distribution in Statistics?
A binomial distribution is a discrete probability distribution that summarizes the number of successes in a fixed number of independent and identical trials. Each trial has two possible outcomes: success (p) or failure (1-p).
Overview: BINOM.DIST Function in Excel
The BINOM.DIST or the BINOMDIST function returns the individual term binomial distribution probability.
Syntax
The syntax for the BINOM.DIST function is given below. It takes 4 mandatory arguments.
=BINOM.DIST(number_s, trials, probability_s, cumulative)➤ Number_s: number of successes in trials.
➤ Trials: number of independent trials.
➤ probability_s: the probability of success on each trial.
➤ cumulative: Logical value, where TRUE returns cumulative distribution function and FALSE returns probability mass function.
Examples of Calculating Binomial Probability in Excel
We’ll learn to calculate the binomial probability by answering the following questions.
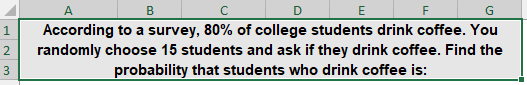
In this example, the number of successes is represented by the students who drink coffee. A total of 15 trials were performed and the probability of success is 80%.
Using Probability Mass Function (FALSE Argument)
➤ The probability that exactly 12 students drink coffee, is 0.250139.
=BINOM.DIST(12,15,0.8,FALSE)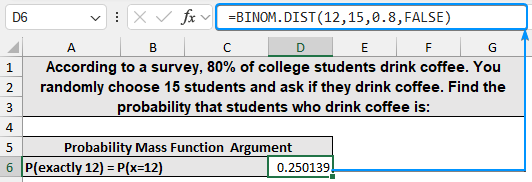
➤ Again, the probability that all 15 of the students drink coffee is 0.035184.
=BINOM.DIST(15,15,0.8,FALSE)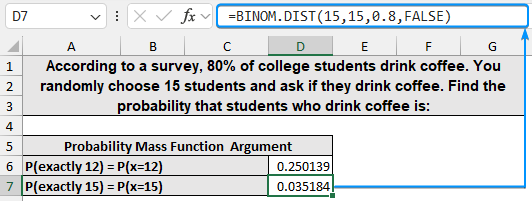
➤ We can calculate a range of successes like at least 13 students drink coffee. This statement can be written as P(x>=13). For greater than or equal to 13 the probabilities have to be P(x=13) or P(x=14) or P(x=15) since there are a total of 15 trials. In probability, the ‘or’ is represented with a plus sign.
=BINOM.DIST(13,15,0.8,FALSE)+BINOM.DIST(14,15,0.8,FALSE)+BINOM.DIST(15,15,0.8,FALSE)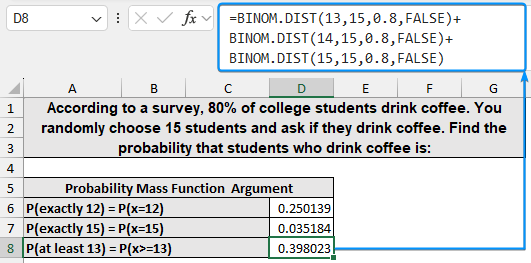
Using Cumulative Distribution Function (TRUE Argument)
➤ For the probability of x less than 5 we need to add up the probabilities of P(x=1), P(x=2), P(x=3), and P(x=4).
=BINOM.DIST(4,15,0.8,TRUE)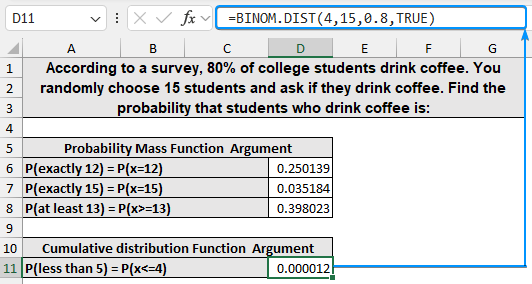
➤ The probability that x is at least 5 represents 5 and greater. Instead of adding all probabilities from P(x=5) through P(x=15), use the complement rule 1 – P(x<=4).
=1-BINOM.DIST(4,15,0.8,TRUE)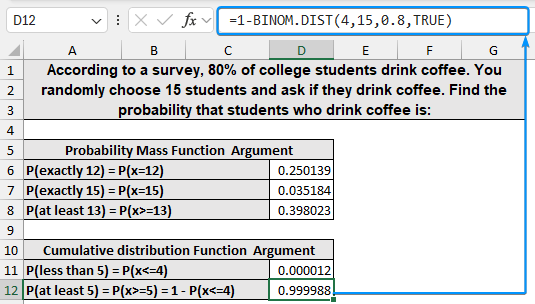
➤ The probability that x is at most 5 represents 5 and lower.
=BINOM.DIST(5,15,0.8,TRUE)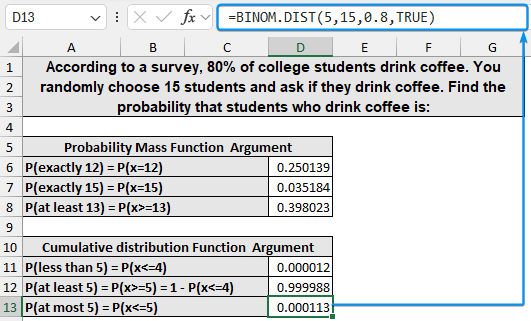
➤ To calculate the probability of x more than 5 we need to add up the probabilities P(x=6) through P(x=15). Again we’ll use the complement rule to rewrite it as 1 – P(x<=5).
=1-BINOM.DIST(5,15,0.8,TRUE)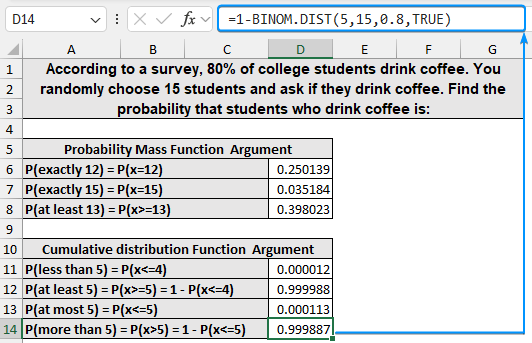
Note:
➤ The number_s and trials arguments should be integers, else they will be truncated to integers.
➤ If number_s, trials, or probability_s arguments are non-numeric, the function returns the #VALUE! error.
➤ If number_s is less than zero or number_s is greater than the trials, the BINOM.DIST function returns the #NUM! error.
➤ If probability_s is less than zero or probability_s is greater than one, the function returns the #NUM! error.
➤ The BINOM.DIST function returns a probability value as a decimal number that ranges between 0 and 1.
FAQ
What is binomial probability?
The likelihood of a specific number of successes in a certain number of independent trials, with each trial having two possible outcomes (success or failure).
How do you calculate binomial probability using Excel?
=BINOM.DIST(number_s, trials, probability_s, cumulative)
When to use the PDF and the CDF argument?
➤ Use the PDF argument when calculating a certain x amount of successes.
➤ Use the CDF argument when calculating x or fewer successes.
How to use BINOM.INV function in Excel?
The BINOM.INV function returns the smallest value for which the cumulative binomial distribution is greater than or equal to a criterion value. Alpha is the criterion value.
=BINOM.INV(trials, probability_s, alpha)
How to use BINOM.DIST.RANGE function in Excel?
The BINOM.DIST.RANGE function returns the probability of a trial result using a binomial distribution.
=BINOM.DIST.RANGE(trials, probability_s, number_s, [number_s2])
Wrapping Up
In this tutorial, we’ve learned about the binomial distribution and how to calculate binomial probability using the BINOM.DIST function. Feel free to download the practice file and share your thoughts and suggestions.