A T-test determines any significant difference between two groups by comparing their mean values. You can use built-in functions and add-ins to do a T-test in Excel.
➤ T-test compares two means to check for any significant difference.
➤ To quickly get the P-value: =T.TEST(array1,array2,tails,type).
➤ For earlier versions of Excel: =TTEST(array1,array2,tails,type).
➤ Use the Data Analysis ToolPak to do paired, equal variance, or unequal variance T-tests.
➤ Perform the F-test first to check if the variances are the same or if they are different.
➤ Excel cannot directly perform one sample T-test, but there is a simple workaround.

In this article, we’ll learn about the T-test and how to perform paired, equal variance, unequal, and one sample T-tests in Excel. We’ll use the T.TEST function and the Data Analysis ToolPak to do the T-test. Lastly, we’ll learn to interpret the T-test results.
What is T-Test in Statistics?
A T-test is a statistical test that compares the means of one or more groups to determine if they are significantly different from each other. We can do the T-test in Excel with the Data Analysis ToolPak. If you want a quick check of the P value then use the T.TEST function. If you’re using an earlier version of Excel use the TTEST function.
T-Test Types
Different types of T-tests depend on the data type and the research design.
➤ Two Sample T-test (Independent T-test): compares the mean of two independent groups to check for any significant difference.
- Equal variance T-test.
- Unequal variance T-test.
➤ Paired T-test (Dependent T-test): compares the mean of the same group at different time frames or under different conditions.
➤ One Sample T-test: determines if the mean of a single sample of data differs from a hypothesized population mean.
Quick T-Test with Excel Functions
The T.TEST or TTEST function returns the probability associated with a Student’s T-test. This function 4 arguments all of whom are required to get the result.
➤ array1 and array2 arguments: the input data range on which the T-test will be performed.
➤ tails: enter the type of distribution
- 1 – for one-tail distribution. Choose one tail if you have a reference value and you want to know the increase or decrease compared to that reference value
- 2 – for two-tail distribution. Choose two tail if there is no reference value and you want to calculate the difference between the two conditions
➤ type: mention the type of T-test you want to perform
- 1 – paired sample T-test.
- 2 – two samples with equal variance (homoscedastic)
- 3 – two samples with unequal variance (heteroscedastic)
In this dataset, we have the student names in Column A and scores before and after the introduction of a new teaching method in Columns B and C. We want to get the P value for different types of T test using the T.TEST function.
Paired T-test
A paired T-test compares the mean values for two related groups to check if there is any significant difference between them.
➤ Select the output cell (E2) and enter the formula:
=T.TEST(A2:A11,B2:B11,2,1)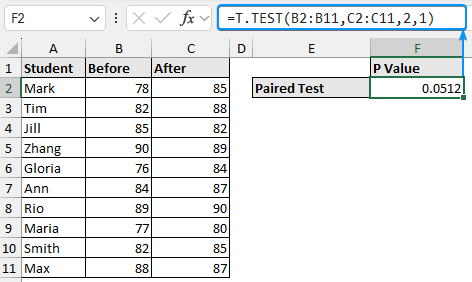
Two Sample T-Test: Equal Variance
A two sample T-test checks if the population means are the same. There are two types of two-sample tests. In the case of equal variance, it is assumed that the variance of the two samples is equal.
➤ Choose the output cell (E3) and enter the formula:
=T.TEST(A2:A11,B2:B11,2,2)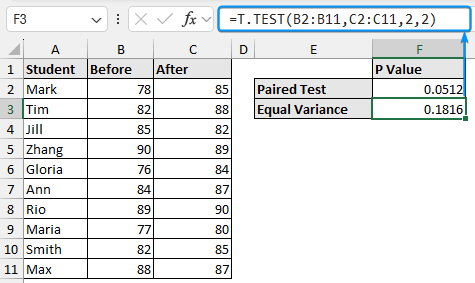
Two Sample T-Test: Unequal Variance
For the unequal variance- it is assumed that the variance of the two samples is not the same. It is also known as Welch’s T-test.
➤ Select the output cell (E4) and enter the formula:
=T.TEST(A2:A11,B2:B11,2,3)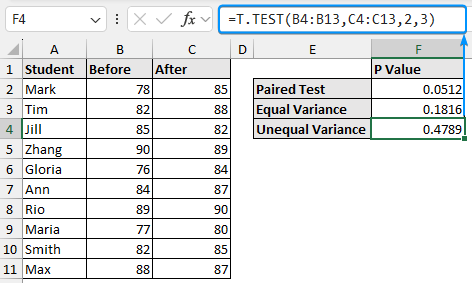
T-Test using Data Analysis ToolPak
The Data Analysis ToolPak can perform various statistical analyses. Using this tool, we can perform various types of T-tests and get comprehensive results.
Paired T-test
Paired T-tests evaluate a pair of observations. Two measurements are taken on the same individual or item before and after an action or intervention. Paired samples are also known as dependent samples.
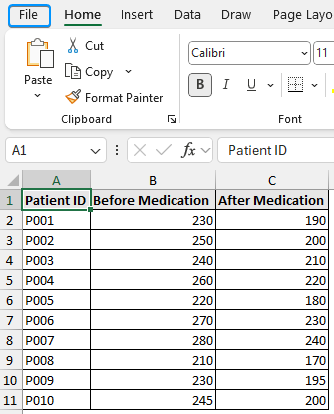
For example, a physician wants to compare the cholesterol levels of two groups of patients before and after taking a new medication. He wants to determine if the mean cholesterol levels before and after taking the medication differ significantly.
Steps:
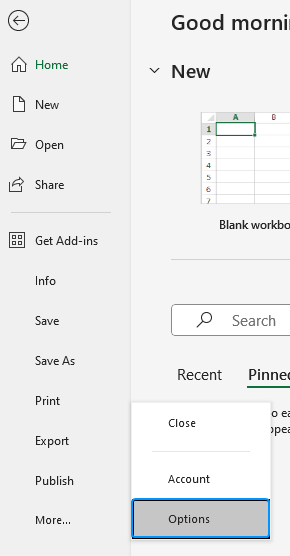
➤ Let’s enable the Data Analysis ToolPak. Click on the File tab.
➤ Select Options. You can also use the shortcut Alt+F+T to open Excel Options.
➤ Select Add-ins >> Choose Excel Add-ins from the dropdown >> Go.
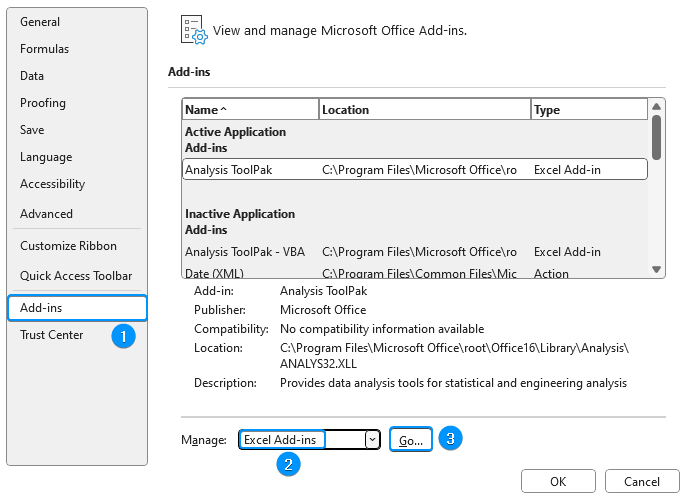
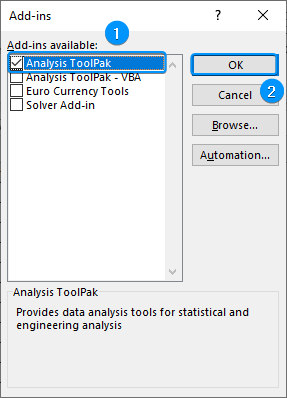
➤ Check the Analysis ToolPak option >> OK.
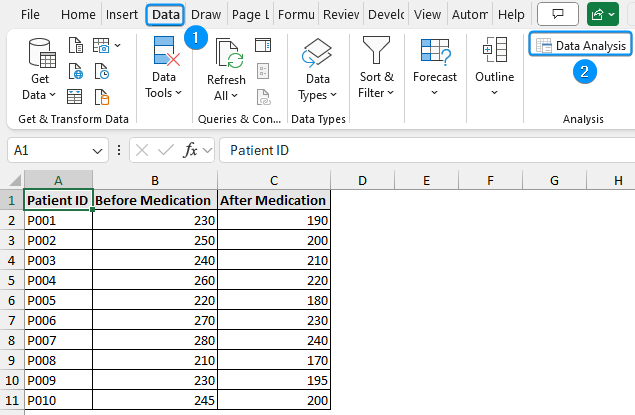
The Data Analysis ToolPak will be available in the Data tab whenever you open a new workbook.
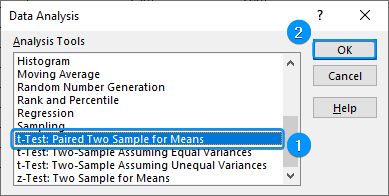
➤ Go to the Data tab >> Select Data Analysis.
➤ Choose t-Test: Paired Two Sample for Means >> OK.
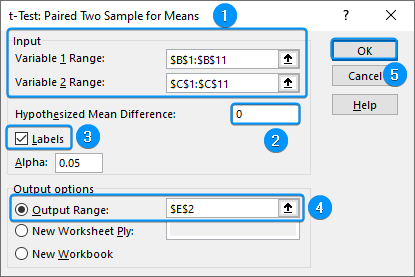
➤ Select the options as shown in the image below. If your data’s first row contains headers, you must check the Labels option.
➤ You’ll get the results shown below.
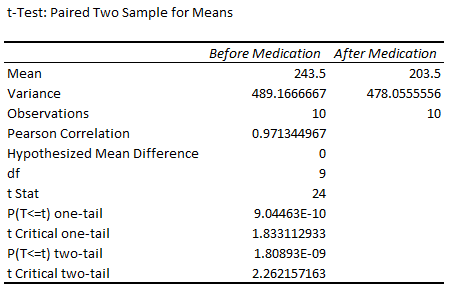
➤ We get mean values of 243.5 and 203.5 before and after the medication.
➤ If the P value is less than the significance level, difference between the mean values is statistically significant.
➤ In this case, if we observe the P value for the two-tailed test, P(T<=t) two tail is less than 0.05. We can infer that the population means differ significantly.
Two Sample T-Test: Equal Variance
As the name suggests, the sample variances are assumed to be equal for this T-test. This type of T-test is performed on unrelated samples containing unique items or individuals.
Consider the example where a researcher compares the starting salaries of recent graduates from two different universities to see if there’s a significant difference in their starting salaries.
Which one to use: Equal Variance or Unequal Variance
If you’re unsure whether the sample variances are equal or not, then it is advisable to perform the F-test first to determine if there is any significant difference in the variances of the two groups.
Steps:
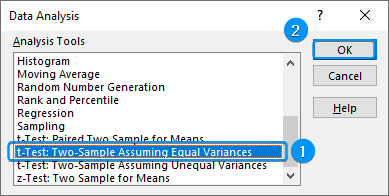
➤ If variances are the same, move to the Data tab >> Data Analysis >> t-Test: Two Sample Assuming Equal Variances.
➤ Select the options as shown in the picture below. Check the Labels option, if the first row contains headers.
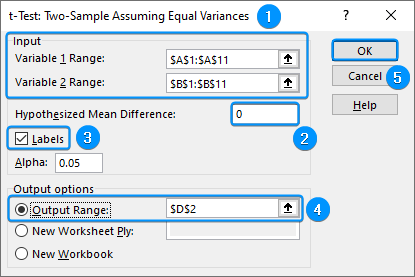
➤ You’ll get the following results.
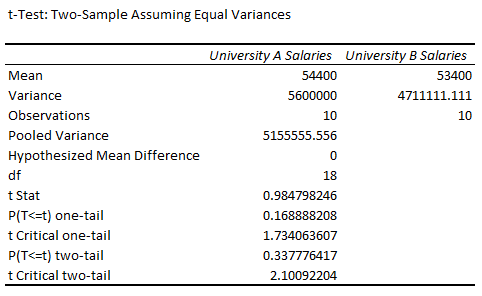
➤ The mean salaries for universities A and B are 54,400 and 53,400.
➤ The variances are unequal, but they are close enough to be considered equal.
➤ If the P value is less than the significance level, difference between the mean values is statistically significant.
➤ The P value for the two-tailed test, P(T<=t) two tail is greater than 0.05. We can conclude that the population means do not differ significantly.
Two Sample T-Test: Unequal Variance
The two sample unequal T-test is performed on independent samples. The variance is assumed to be unequal for this test.
Let’s say we are comparing the monthly sales figures of sales representatives from two different regions to see if there’s a significant difference in their performance.
Steps:
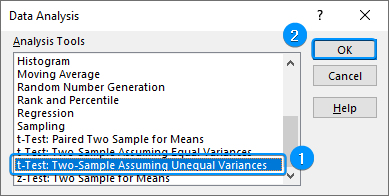
➤ In the Data tab, click on Data Analysis >> t-Test: Two Sample Assuming Unequal Variances.
➤ Choose the options as shown below. Tick the Labels option, if the first row contains headers.
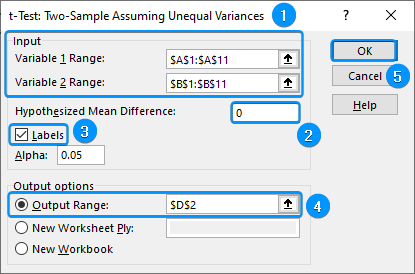
➤ The results will be displayed in the output range.
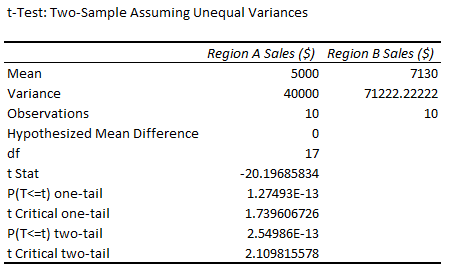
➤ The mean sales for regions A and B are 5,000 and 7,130.
➤ The variances in sales are different.
➤ If the P value is less than the significance level, difference between the mean values is statistically significant.
➤ The P value for the two-tailed test, P(T<=t) two tail is less than 0.05. We can conclude that the population means differ significantly.
One Sample T-Test in Excel
The one sample T-test is used to determine if the population mean is equal to a certain hypothesized value. Although you cannot conduct the one sample T-test directly in Excel, there’s a simple workaround.
For example, a company wants to know if the average number of hours worked per week is equal to the standard 40-hour work week.
Steps:
➤ Start by calculating the sample size, sample mean, and sample standard deviation of the weekly work hours. The formulas are given below.
=COUNT(B2:B11)=AVERAGE(B2:B11)=STDEV.S(B2:B11)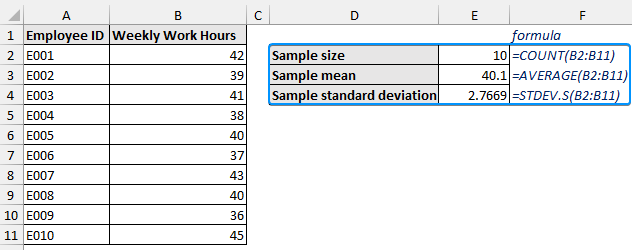
➤ The hypothesized mean is the standard 40 hours per week. Calculate the T-test statistic using the formula:
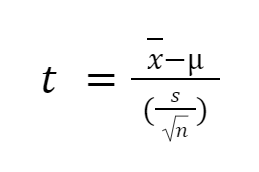
where,
𝑥̄ is the sample mean
μ is the hypothesized mean
s is the sample standard deviation
n is the sample size
The T-test statistic is 0.1143.
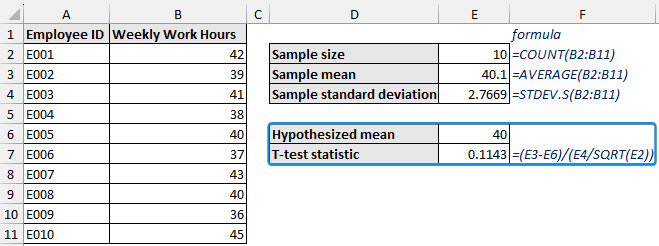
➤ Calculate the degrees of freedom by subtracting one from the sample size.
=E2-1➤ Use the T.DIST.2T function to get the P-value. The first argument is the T-test statistic and the second argument is the degrees of freedom.
=T.DIST.2T(ABS(E7),E9)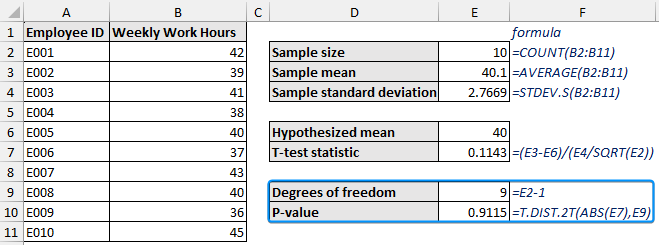
➤ The P-value of our test is greater than the significance level. We cannot say that the mean working hour is different from the standard 40-hour work week.
FAQ
When to use T-test?
A T-test is used in hypothesis testing to assess whether a process or treatment has any significant effect on the population or to determine if there is a difference between two groups.
What type of T-test should I use in Excel?
➤ One sample T-test: If you have one sample of data and want to test if the sample mean is significantly different from a known value.
➤ Two sample T-test: If you have two independent or unrelated samples and want to determine if their means differ.
➤ Paired T-test: If you have two related or dependent measurements from the same individuals or items and want to compare the mean value at different times or under different conditions.
What is the P value formula in Excel?
Excel’s T.TEST function calculates the P-value. The syntax for this function is =T.TEST(array1,array2,tails,type). On older versions of Excel, you’ll find the TTEST function with the same syntax.
How to read Excel T-test results?
You should compare:
➤ T-statistic to the critical T-values.
➤ P-value to the significance level.
Based on this you can reject or not reject the null hypothesis and conclude if there is a significant difference between the groups or conditions tested.
Wrapping Up
This comprehensive tutorial taught us about the T-test and its types. We explored how to use the T.TEST function and Data Analysis ToolPak to do a T-test in Excel and interpret our test results. Feel free to download the practice file and let us know which method you like the most.