Transposing data in Google Sheets is an efficient method that lets users switch the orientation of their dataset. It is particularly helpful for improving data visualisation and data readability. Google Sheets allows users to transpose their data using various built-in tools and functions.
To transpose rows to columns in Google Sheets, follow the steps below:
➤ First, copy the entire dataset.
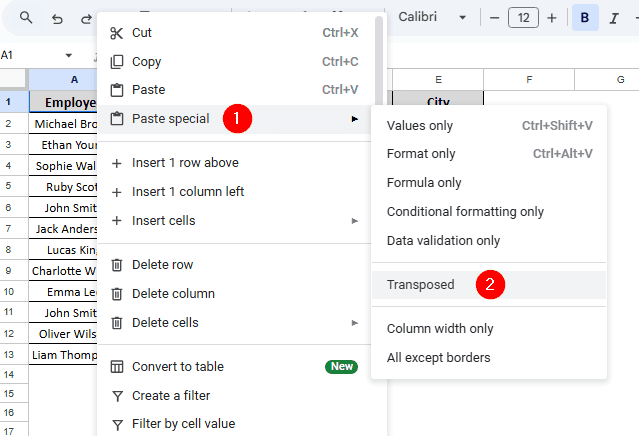
➤ Then, go to a new worksheet and open the context menu by right-clicking your mouse.
➤ From the context menu, head to Paste special >> Transposed.
➤ Your dataset should now be transposed from rows to columns or vice versa.
In this article, we will learn four easy methods of transposing rows to columns in Google Sheets.
Transpose Rows to Columns Using the Paste Special Tool
Paste special in Google Sheets is a powerful tool that lets users selectively paste special attributes of copied data. It can also be used to transpose the rows of a dataset into columns.
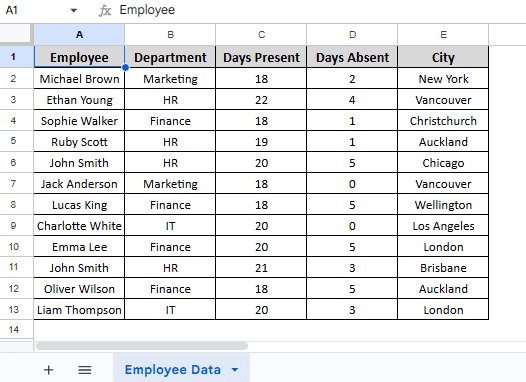
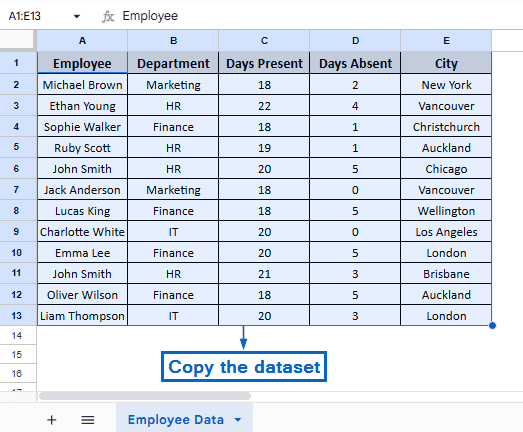
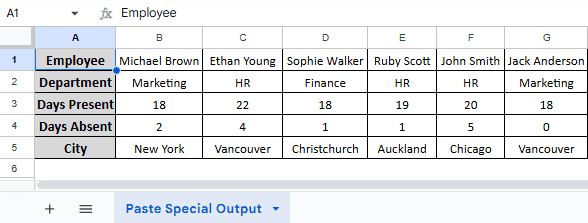
In the sample dataset, we have a worksheet called “Employee Data” containing information about Employee, Department, Days Present, Days Absent and City in columns A, B, C, D and E, respectively. By using the Paste special tool, we will transpose rows of this dataset into columns. The transposed dataset will be displayed in a separate worksheet called “Paste Special Output”.
Steps:
➤ From the “Employee Data” worksheet, copy the entire dataset.
➤ Then, go to the “Paste Special Output” worksheet and right-click your mouse to bring out the context menu.
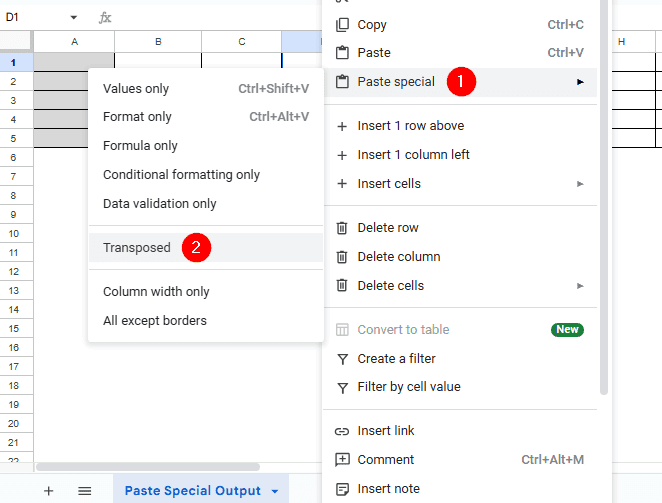
➤ From the context menu, head to Paste special >> Transposed. Your data should now be transposed from rows to columns.
Transpose Rows to Columns Using the TRANSPOSE Function
The TRANSPOSE function in Google Sheets is another efficient tool that automatically converts rows to columns. It can also auto-update when the source data changes. We will again work with the same dataset and transpose columns A to E from the “Employee Data” worksheet using the TRANSPOSE function. We will display the transposed data in the “Transpose Function Output” worksheet.
Steps:
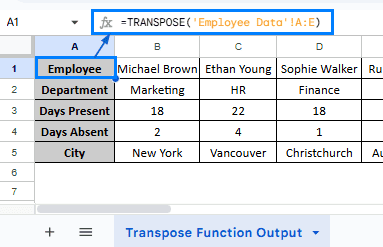
➤ Head to “Transpose Function Output” worksheet, select Cell A1 and paste the formula:
=TRANSPOSE(‘Employee Data’!A:E)
Note:
This formula uses the Transpose function to convert the rows of range A:E from the “Employee Data” worksheet into columns.
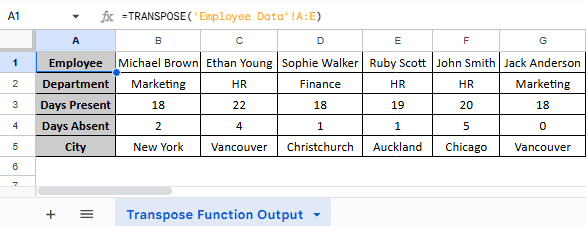
➤ Next, press Enter. You should now have your dataset transposed.
Transpose Rows to Columns Using Apps Script
Google Apps Script is another useful tool that lets users automate the transposition of rows to columns. This method is ideal for handling large datasets in Google Sheets. Just like the second method, this method can also update the dataset automatically if any changes are made to the source data file. We will work with the same dataset used in previous methods and display the transposed output in the “Apps Script Output” worksheet.
Steps:
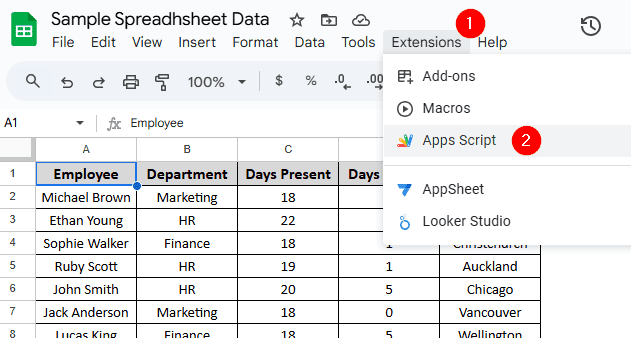
➤ Open “Apps Script Output” worksheet and head to Extensions >> Appscript.
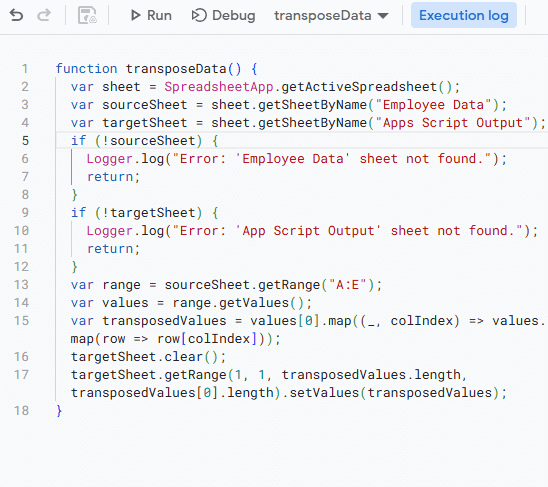
➤ Open the script editor and paste the following code:
function transposeData() {
  var sheet = SpreadsheetApp.getActiveSpreadsheet();
  var sourceSheet = sheet.getSheetByName("Employee Data");
  var targetSheet = sheet.getSheetByName("Apps Script Output");
  if (!sourceSheet) {
    Logger.log("Error: 'Employee Data' sheet not found.");
    return;
  }
  if (!targetSheet) {
    Logger.log("Error: 'App Script Output' sheet not found.");
    return;
  }
  var range = sourceSheet.getRange("A:E");
  var values = range.getValues();
  var transposedValues = values[0].map((_, colIndex) => values.map(row => row[colIndex]));
  targetSheet.clear();
  targetSheet.getRange(1, 1, transposedValues.length, transposedValues[0].length).setValues(transposedValues);
}
Note:
In the above custom script,
➧ var sheet = SpreadsheetApp.getActiveSpreadsheet(); Gets the current Google Sheets file that you are working on.
➧ var sheet = SpreadsheetApp.getActiveSpreadsheet();
var sourceSheet = sheet.getSheetByName(“Employee Data”);
It lists the source and target sheets by their name.
➧ if (!sourceSheet) {
Logger.log(“Error: ‘Employee Data’ sheet not found.”);
return;
}
if (!targetSheet) {
Logger.log(“Error: ‘App Script Output’ sheet not found.”);
return;
}
This part of the script acts as a breakpoint. If the target sheet is not found, the script stops.
➧ var range = sourceSheet.getRange(“A:E”);
var values = range.getValues();
This part tells the script to source all data from columns A to E in the “Employee Data” worksheet.
➧ var transposedValues = values[0].map((_, colIndex) => values.map(row => row[colIndex]));
This is the actual part of the script that performs the transpose operation.
➧ targetSheet.getRange(1, 1, transposedValues.length, transposedValues[0].length).setValues(transposedValues);
Finally, this tells the script to store the transposed dataset values from cell A1 to the output sheet.
➤ Lastly, head to the “Apps Script Output” worksheet, your dataset should now be automatically transposed.
![]()
Transpose Every N Rows to Columns
This method allows users to transpose a N number of rows into multiple columns of their choice. It is ideal for organising a wide, structured dataset into a more compact format. We will use the INDEX function for this method.
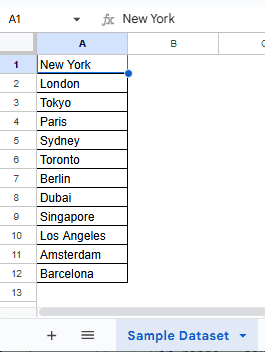
In the new dataset, we have a worksheet called “Sample Dataset” containing the names of 12 random cities in a single column. By using this method, we will transpose these 12 columns into 4 rows and 3 columns. The transposed data will be displayed in a separate worksheet called “Transposed Output”.
Steps:
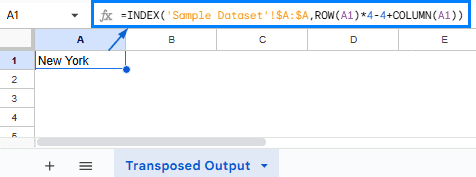
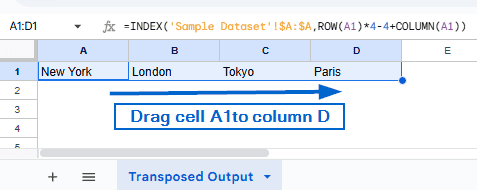
➤ Open the “Transposed Output” worksheet. In cell A1, put the formula:
=INDEX(‘Sample Dataset’!$A:$A,ROW(A1)*4-4+COLUMN(A1))
Note:
The INDEX function in the formula is used to return the value from a specific row in column A of the “Sample Dataset” worksheet. ROW(A1) and COLUMN(A1) return the current row and column number. ROW(A1)*4-4+COLUMN(A1) part tells the formula to fetch data in sets of 4, moving right for each column and down for the next group.
➤ Then, press Enter. You should see the name of a single city being displayed.
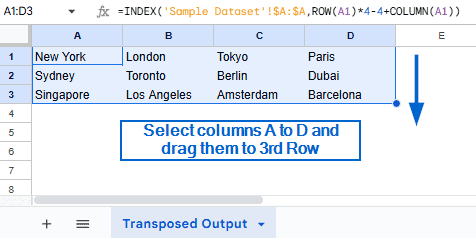
➤ Now, drag cell A1 up to column D.
➤ Again, select columns A to D and drag them down to the 3rd Row. You should now have the names of all 12 cities transposed into 4 rows and 3 columns.
Frequently Asked Questions
Why Does My Transposed Data Show #REF! Error?
Your dataset might show #REF! error if you have insufficient space to display the transposed data. Make sure your output sheet has enough space for rows and columns to accommodate the transposed range.
Can I Transpose Data Across Different Spreadsheet Files?
Yes, you can easily transpose rows to columns across different spreadsheet files by using the IMPORTRANGE function. An example of using the IMPORTRANGE function for this dataset would be:
=TRANSPOSE(IMPORTRANGE(“spreadsheet_url”, ‘Employee Data’!A:E))
Concluding Words
Transposing rows to columns in Google Sheets is crucial to reorganize data for better visualization and presentation. In this article, we have discussed four efficient methods of transposing rows to columns, including using the Paste special tool, Transpose function, INDEX function and custom Apps Script. Try out both methods and see which one fits your workflow the best.