Not every observation has an equal weight when analyzing real world data. Assignments and tests frequently have varied weights, in finance, some transactions may account for higher volumes, and in survey data, some respondents may have a greater significance. This is where the weighted median becomes relevant since it accounts for the weight of each observation when determining the center value of the data range. In this article, you will learn about the weighted median and how to calculate the weighted median in Excel. We will also cover two unique situations you could run into when determining the weighted median.
➤ The data corresponding to which cumulative weight exceeds half of the sum of weights represents the weighted median. In this article, you’ll learn about the weighted median and how to calculate the weighted median in Excel by combining various functions in a formula. We will also look at two edge cases for the weighted median.
➤ If the cumulative sum equals half of the sum of weights, average of the two values is the weighted median.
➤ Weighted median formula: =IF(MATCH(TRUE, cum_range >= SUM(weight)/2, 0) > 1,IF(INDEX(cum_range, MATCH(TRUE, cum_range >= SUM(weight)/2, 0)) = SUM(weight)/2,(INDEX(data_range, MATCH(TRUE, cum_range >= SUM(weight)/2, 0)) +INDEX(data_range, MATCH(TRUE, cum_range > SUM(weight)/2, 0))) / 2, INDEX(data_range, MATCH(TRUE, cum_range >= SUM(weight)/2, 0))),INDEX(data_range, MATCH(TRUE, cum_range >= SUM(weight)/2, 0)))
What Is Weighted Median?
The weighted median is the middle value of a dataset where each data point contributes according to its weight. The weighted median ensures that the significant values have a proportionate effect on the result. This is ignored by the standard median, where all the data points have equal weights.
The steps to calculate the weighted median are as follows:
- Sort the data in ascending order.
- Find the cumulative weights.
- Determine the minimum value at which the cumulative weight is at least 50% of the total weight.
Excel does not have a function to calculate the weighted median. However, we can combine functions in a formula to determine the weighted median in Excel.
Calculating Weighted Median in Excel
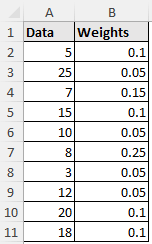
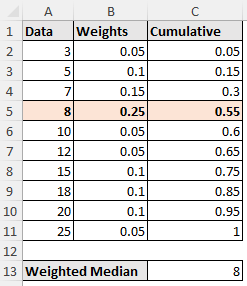
Consider the simple dataset containing data in column A and weights in column B.
Using this dataset, we will determine the weighted median in Excel. Then we will look at a few edge cases when calculating the weighted median.
Steps:
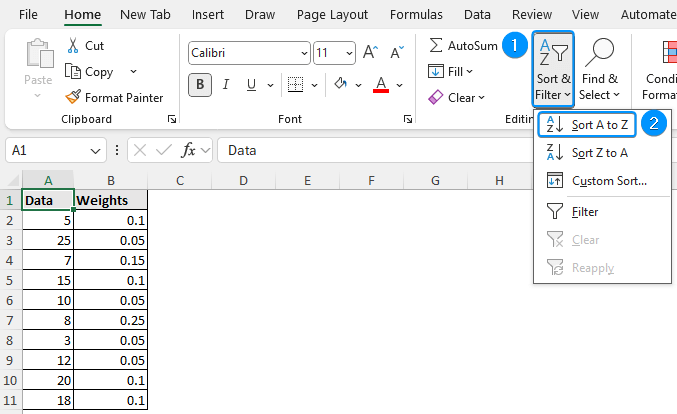
➤ First, we need to sort the data from smallest to largest.
➤ Select any data point >> In the Home tab, under the Editing section, click on Sort & Filter >> Sort Smallest to Largest.
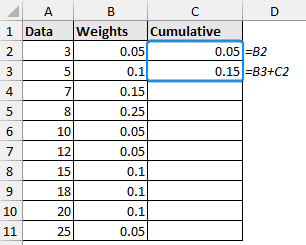
➤ Construct a column for the cumulative frequency. Enter the formulas.
=B2
=B3+C2
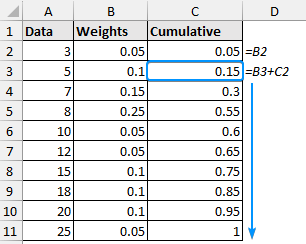
➤ Drag the Fill Handle to copy the formula below.
➤ Enter the weighted median formula in the output cell.
=IF(MATCH(TRUE, C2:C11 >= SUM(B2:B11)/2, 0) > 1,IF(INDEX(C2:C11, MATCH(TRUE, C2:C11 >= SUM(B2:B11)/2, 0)) = SUM(B2:B11)/2,(INDEX(A2:A11, MATCH(TRUE, C2:C11 >= SUM(B2:B11)/2, 0)) +INDEX(A2:A11, MATCH(TRUE, C2:C11 > SUM(B2:B11)/2, 0))) / 2,INDEX(A2:A11, MATCH(TRUE, C2:C11 >= SUM(B2:B11)/2, 0))),INDEX(A2:A11, MATCH(TRUE, C2:C11 >= SUM(B2:B11)/2, 0)))
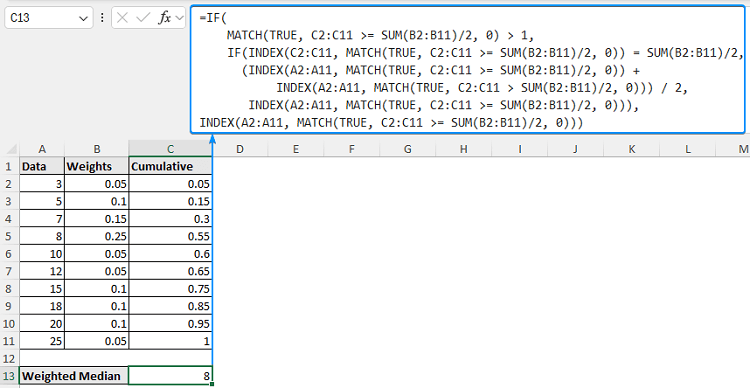
In the C5 cell, the cumulative weight first exceeds 0.5; therefore, 8 is the weighted median.
Optional Formatting
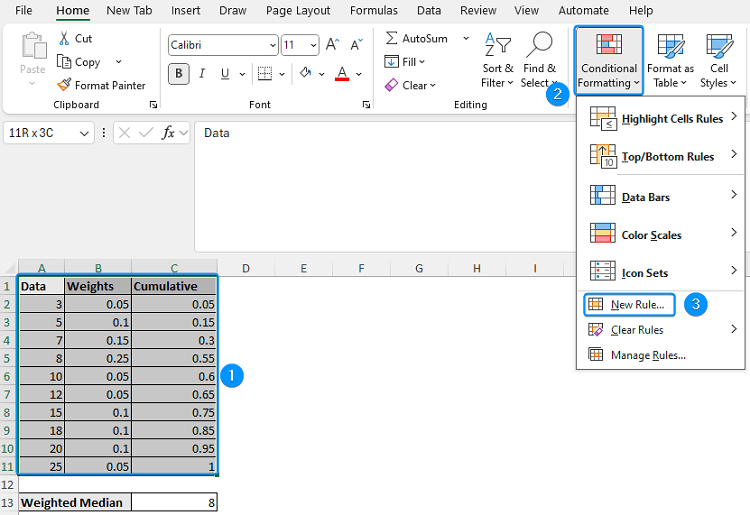
This is an optional step to highlight the row containing the weighted median. This is a dynamic formatting that will be applied automatically, provided the necessary inputs are given.
➤ Select the entire data range (A1:C11) >> In the Home tab, click on Conditional Formatting >> New Rule.
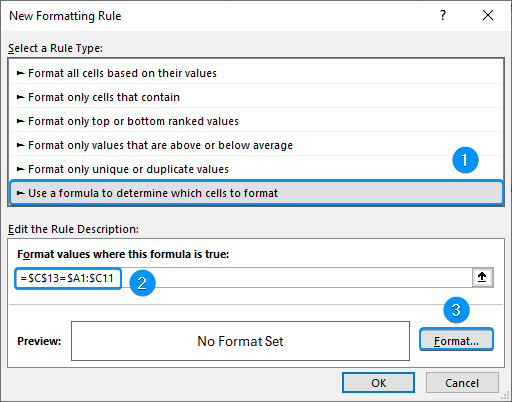
➤ Select the option Use a formula to determine which cells to format.
➤ Enter the formula below. This formula matches the calculated weighted median from the entire data range and highlights the row where the condition is TRUE.
=$C$13=$A1:$C11
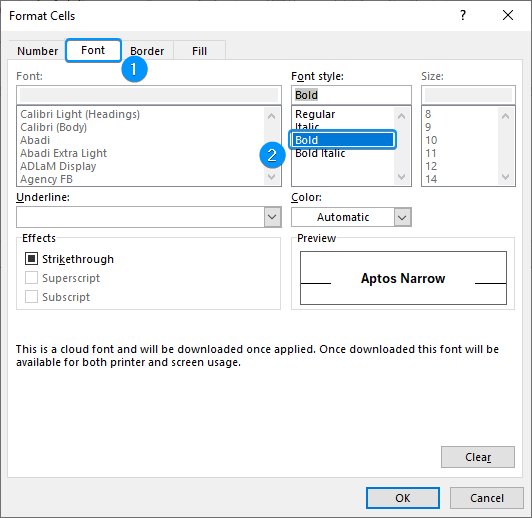
➤ Click the Format button >> Font tab >> Select Bold.
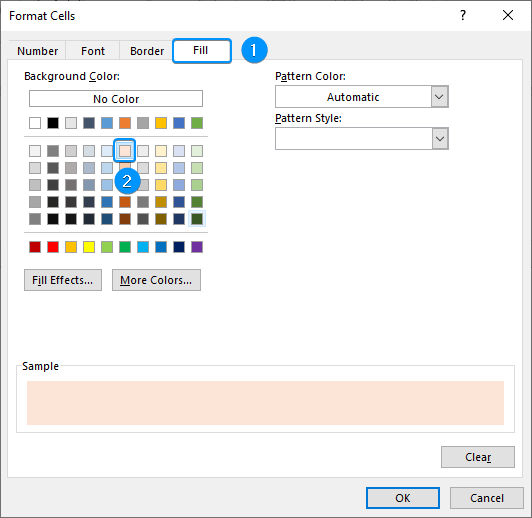
➤ In the Fill tab >> Choose a fill color (Orange, Accent 2, Lighter 80%) >> OK.
➤ The row containing the weighted median class will be formatted.
Weighted Median When Sum of Weights is More Than One
If the weights add up to 100 instead of one, the weighted median formula will be the same.
Steps:
➤ Enter the formula in cell C13.
=IF(MATCH(TRUE, C2:C11 >= SUM(B2:B11)/2, 0) > 1,IF(INDEX(C2:C11, MATCH(TRUE, C2:C11 >= SUM(B2:B11)/2, 0)) = SUM(B2:B11)/2,(INDEX(A2:A11, MATCH(TRUE, C2:C11 >= SUM(B2:B11)/2, 0)) +INDEX(A2:A11, MATCH(TRUE, C2:C11 > SUM(B2:B11)/2, 0))) / 2,INDEX(A2:A11, MATCH(TRUE, C2:C11 >= SUM(B2:B11)/2, 0))),INDEX(A2:A11, MATCH(TRUE, C2:C11 >= SUM(B2:B11)/2, 0)))
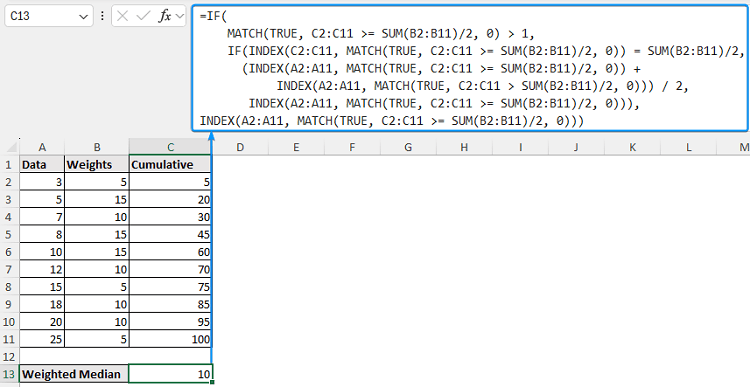
In cell C6, the cumulative weight exceeds 50, so the weighted median is 10.
Weighted Median When Cumulative Sum Exactly Equals Half the Sum of Weights
If the cumulative sum equals exactly half of the sum of weights, then take the average of the two values. For example, if the cumulative weight at 8 is exactly 0.50, and the next cumulative weight at 10 is 0.65. Then the weighted median will be the average of the two data points, like ((8+10)/ 2=9).
Steps:
➤ Move to cell C13 and use the formula.
=IF(MATCH(TRUE, C2:C11 >= SUM(B2:B11)/2, 0) > 1,IF(INDEX(C2:C11, MATCH(TRUE, C2:C11 >= SUM(B2:B11)/2, 0)) = SUM(B2:B11)/2,(INDEX(A2:A11, MATCH(TRUE, C2:C11 >= SUM(B2:B11)/2, 0)) +INDEX(A2:A11, MATCH(TRUE, C2:C11 > SUM(B2:B11)/2, 0))) / 2,INDEX(A2:A11, MATCH(TRUE, C2:C11 >= SUM(B2:B11)/2, 0))),INDEX(A2:A11, MATCH(TRUE, C2:C11 >= SUM(B2:B11)/2, 0)))
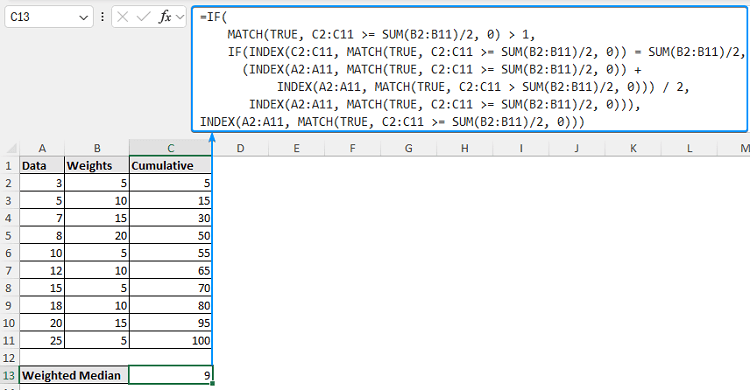
In cell C5, the cumulative weight equals 50 (exactly half the sum of weights); in cell C6, it is 55 (greater than 50). Hence, the weighted median will be the average of 8 and 10, which is 9.
Frequently Asked Questions
What is the difference between a weighted average and a weighted median?
A weighted average multiplies values by their weights then divides by the sum of all the weights. In contrast, a weighted median represents the 50th weighted percentile where each data point contributes according to its weight.
Is it possible to determine the weighted median without sorting the data?
No. To calculate the weighted median, the dataset must be sorted in ascending order.
What if there are negative weights in my dataset?
It is not possible to calculate the median using negative weights.
In what situations should I use weighted median rather than median?
In situations like financial transactions, test results, or survey replies where each observation has varying significance.
Wrapping Up
In this tutorial, we’ve learned about the weighted median and how to calculate the weighted median in Excel. Additionally, we looked at two edge cases when calculating the weighted median. Feel free to download the practice file and share your thoughts and suggestions.