Pivot Tables in Excel are used for summarizing large numerical datasets. While the default grouping feature works well for dates or equal numeric steps, grouping data into uneven, custom intervals (like different price tiers or mark ranges) presents a common challenge. When you try to group a field by numbers, Excel’s built-in Grouping feature only allows for equal-sized intervals. For instance, you can group marks by 10s (0-10, 11-20, etc.) but not by custom ranges like (0-39, 40-59, 60-74).
In this article, we will guide you through two essential methods to group numerical data in a Pivot Table: one for equal intervals using the grouping tool, and another for uneven intervals using a helper column and the VLOOKUP function.
To group data in a Pivot Table by an uneven interval, the simplest solution is to use a helper column in your source data.
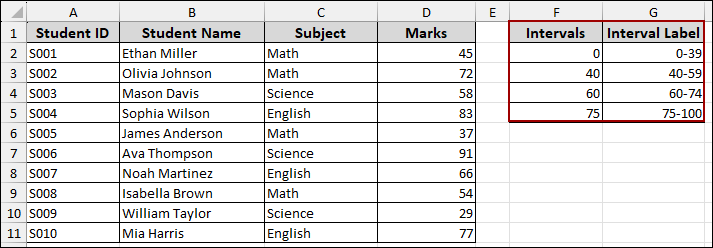
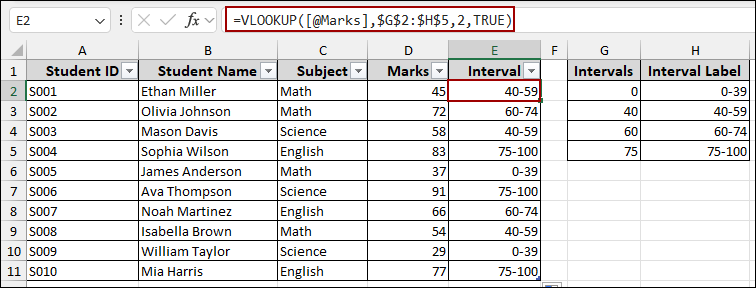
➤ Create a lookup table with the minimum value of each interval and its corresponding label (e.g., 0, 40, 60, 75).
➤ Use the VLOOKUP function in a new column with the TRUE setting for approximate matching to assign the correct interval label to each record.
➤ Base your Pivot Table on the updated data and use the Interval Label field in the Rows area to successfully group the Pivot Table by different intervals.

Grouping by Equal Intervals in Pivot Table
The Pivot Table Grouping feature is the fastest method to group data by equal intervals. You can use this method for scenarios where you need to group sales figures or marks into intervals of the same size.
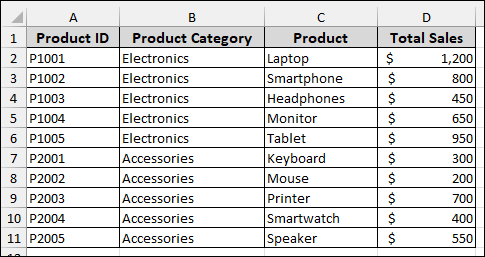
Imagine a sample dataset showing various products and their total sales. Here, we will convert this data into a Table and then create a Pivot Table to group according to their sales value.
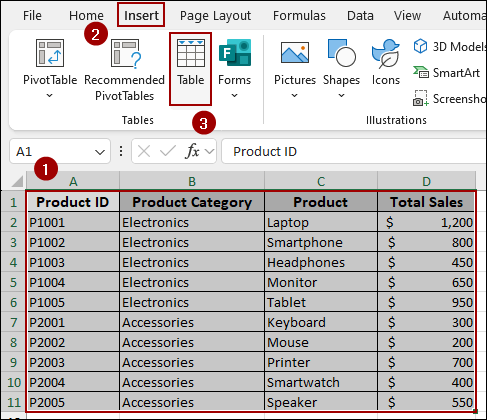
To convert the data range into an Excel Table.
➤ Select the dataset (A1:D11).
➤ Go to the Insert tab on the ribbon.
➤ Click the Table option.
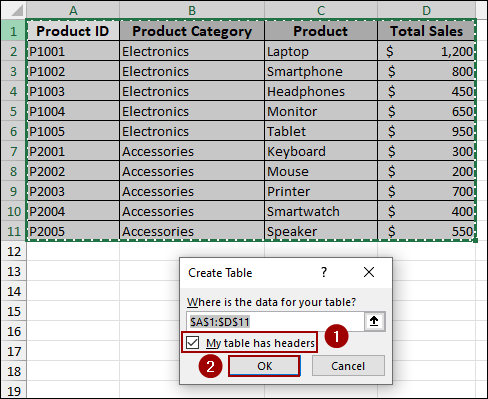
In the Create Table dialog box:
➤ Ensure the data range is correct.
➤ Checkmark My table has headers.
➤ Click OK.
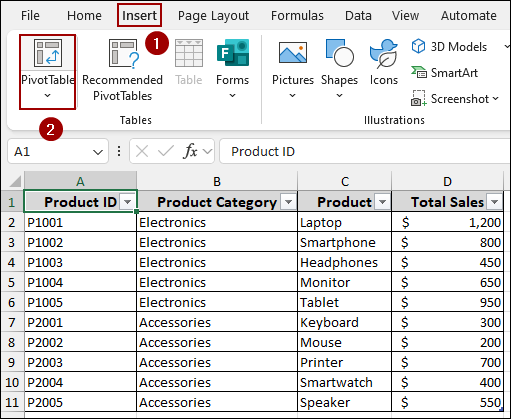
Now, we will insert the Pivot Table.
➤ Go to the Insert tab.
➤ Click the PivotTable button.
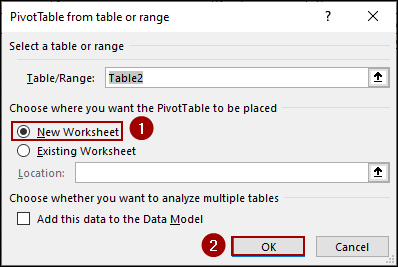
In the new dialog box:
➤ Choose New Worksheet to place the Pivot Table on a clean sheet.
➤ Click OK.
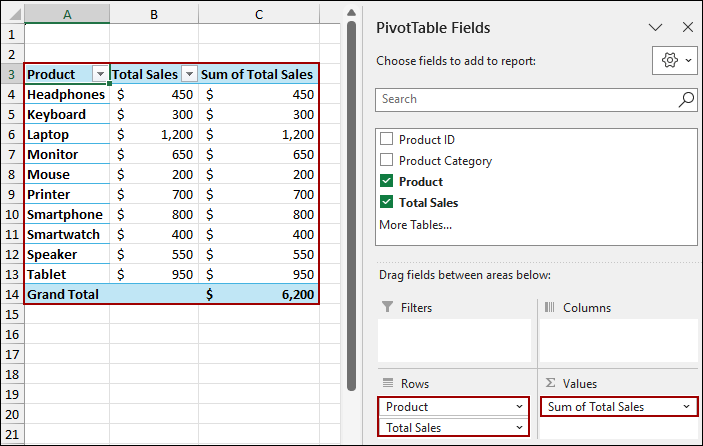
To prepare for grouping, drag the numerical field you wish to group into the Rows area.
➤ Drag the Product field to the Rows area.
➤ Drag the Total Sales field to the Rows area.
➤ Drag the Total Sales field again to the Values area (it will automatically become Sum of Total Sales).
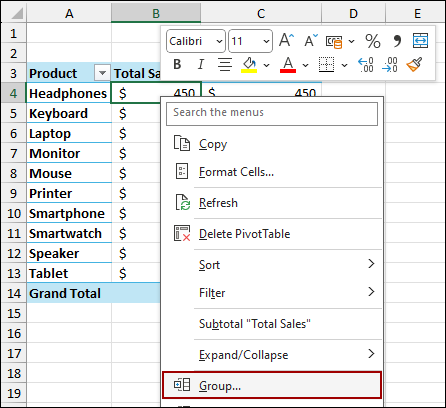
With the numerical field (Total Sales) in the rows, you can now apply the grouping.
➤ Right-click on any value in the Total Sales column of your Pivot Table (e.g., cell B4).
➤ From the context menu, click Group.
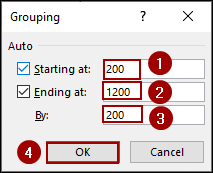
The Grouping dialog box allows you to define the start, end, and size of the intervals.
For this example, we want to group sales in 200 increments.
➤ In the Starting at box, enter the lowest value 200.
➤ In the Ending at box, enter the highest value 1200.
➤ In the By box, enter the interval size 200.
➤ Click OK.
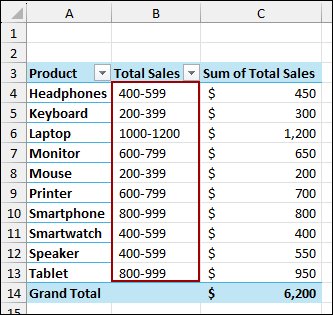
The Pivot Table now successfully groups the sales figures into equal 200 intervals, such as 400-599, 200-399, and so on.
Using Helper Column to Group by Uneven Intervals in Pivot Table
When you need to create custom, uneven intervals (e.g., grading scales), the native grouping tool is ineffective. For this, we must use a Helper Column with a formula.
Suppose we have a sample dataset of some students’ obtained marks according to different subjects. We also have some uneven intervals of student marks and grouped them into the following custom intervals.
First, we will create a table with the main student data.
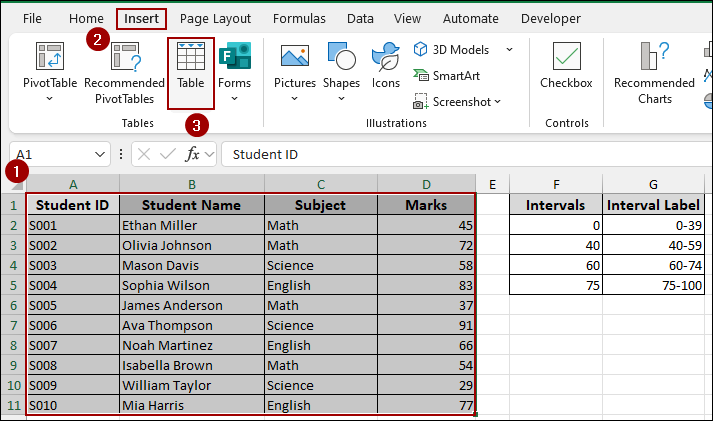
➤ On the main data sheet, select your data (A1:D11).
➤ Click Insert > Table.
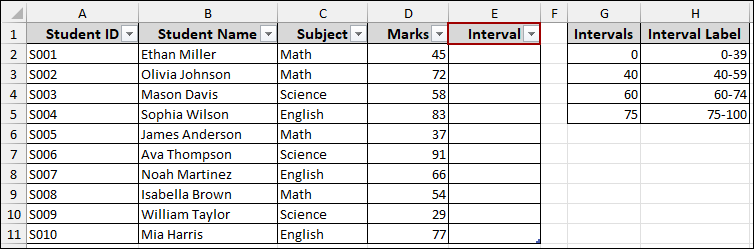
➤ Add a new column next to the Marks column and name it Interval.
➤ In cell E2 (the first cell of the Interval column), enter the following formula, press ENTER, and drag down the Fill Handle.
=VLOOKUP([@[Marks]], $G$2:$H$5, 2, TRUE)
Formula Breakdown:
➧ [@[Marks]]: This refers to the student’s mark in the current row.
➧ $G$2:$H$5: This is the fixed range of our lookup table.
➧ 2: This tells the VLOOKUP function to return the value from the 2nd column of the lookup table (Interval Label).
➧ TRUE: It enables approximate matching, finding the correct interval.
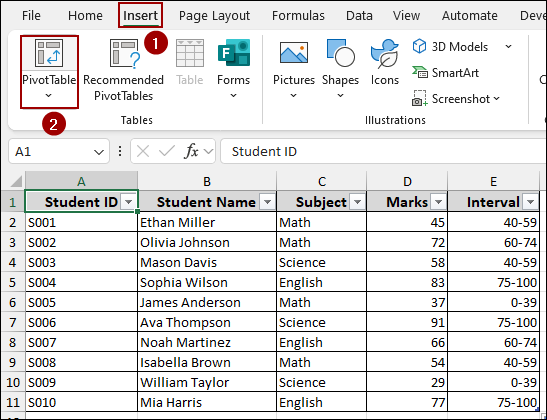
Now that the source data is complete with the custom interval column, we will create the Pivot Table.
➤ Click anywhere inside the main data table.
➤ Go to the Insert tab.
➤ Click PivotTable.
➤ Choose to place it on a New Worksheet and click OK.
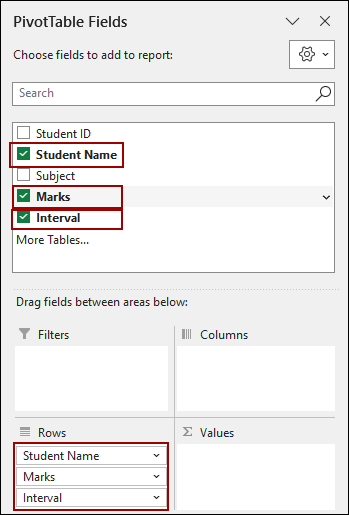
The new Interval column can now be used as a grouping field.
➤ Drag the Interval, Student Name, and Marks field to the Rows area.
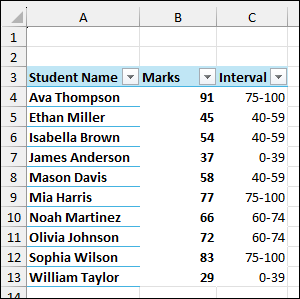
As a result, we will get the Pivot Table successfully grouping the students by the custom, uneven intervals.
Frequently Asked Questions
Why is the Group option grayed out in my Pivot Table?
This usually happens when your field contains blank cells, text values in numeric columns, or mixed data types. Make sure the column has clean numeric or date values before grouping.
Why can’t I group my dates into months or years?
This happens if the date column has text-formatted dates or invalid entries. Convert them into a proper date format before grouping.
Can I group one field into multiple types of intervals at the same time?
Yes. For dates, you can group by months and years simultaneously. For numbers, you can only group into one set of intervals at a time (but you can add helper columns in your dataset for custom grouping).
Concluding Words
Above, we have explored the two primary methods for grouping data in an Excel Pivot Table. For quick analysis using consistent intervals, the built-in Grouping feature is the easiest choice. However, when your analysis demands custom, uneven intervals, the Helper Column method using the VLOOKUP function is the simplest solution. If you have any questions, please don’t hesitate to share them in the comments section below.