We often need to analyse a dataset in Excel, whether we are in the data field or students, or in any kind of data-related job. And, no matter whether we need to do a deep analysis or just find some information about the dataset, we all need to perform the descriptive statistics first. Because these descriptive statistics give us a summarized result, including mean, median, etc., that helps us to have a general idea about the data.
Suppose you are working with a monthly sales revenue dataset that has data from multiple regions. Now, before doing any analysis on it, if you perform descriptive statistics, you can instantly see the average sales, the highest and lowest sales, and even spot the variations among different regions. These results will give you a head up on what the data is telling us.
In this article, we will explain how you can perform descriptive statistics in Excel using the Data Analysis ToolPak.
➤ First, click on the File tab at the top of the dataset.
➤ Now, it will take you to a new window. Select the Options in it.
➤ It will take you back to the dataset window, and a pop-up will come out. Select Add-ins from it.
➤ Now, at the bottom of this pop-up, find the box beside Manage. Click on it, and a list with a few options will appear. Choose Excel Add-ins from them and click on Go.
➤ Another pop-up will appear, and choose Analysis ToolPak in it. Then, click Ok.
➤ Go to the Data tab from the upper menu bar, and you will see a new tab called Data Analysis under the Analysis option.
➤ Now, click on the Data Analysis option, and a list will appear. Choose Descriptive Statistics from the list and click OK.
➤ You will see another new window called Descriptive Statistics. In it, inside the Input Range, select E1 to E13, i.e., the profits. Here, cell E1 is the header. So, check on the Labels in First Row box. Also, make sure Grouped by is selected as Columns.
➤ Now, for the Output Range, select any empty cell. For our dataset, we will select cell F1.
➤ Then, check on Summary Statistics. If you need, you can also check on the Confidence Level for Mean box. Finally, press ok.
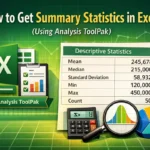
➤ The summary statistics will appear in the F column. In it, you can see the mean, median, standard error, mode, maximum value, minimum value, sum, count, etc., elements of the profit of that store.

Using Data Analysis ToolPak to Perform Descriptive Statistics in Excel
The Data Analysis ToolPak is one of the easiest methods to do descriptive statistics in Excel. And the best part is, with this function, you can directly get the descriptive statistics and will not need any formula.
We will use the dataset below to explain how you can perform descriptive analysis with the Data Analysis ToolPak.

This is a monthly sales dataset of a chain shop in four different regions, which has the total sales data, how many units have been sold in each month, and how much profit the store gained in each month.
Step 1: Enable the Data Analysis ToolPak
The Data Analysis ToolPak is a built-in feature of Excel. However, like most of the built-in features, this one is not visible. So, first, we need to enable this hidden feature.
Steps:
➤ First, click on the File tab at the top of the dataset.

➤ Now, it will take you to a new window. Select the Options in it.

➤ It will take you back to the dataset window, and a pop-up will come out. Select Add-ins from it.
➤ Now, at the bottom of this pop-up, find the box beside Manage. Click on it, and a list with a few options will appear. Choose Excel Add-ins from them and click on Go.

➤ Another pop-up will appear, and choose Analysis ToolPak in it. Then, click Ok.

➤ Go to the Data tab from the upper menu bar, and you will see a new tab called Data Analysis under the Analysis option.

Step 2: Use the Descriptive Statistics
Now, our Data Analysis ToolPak is enabled, and we can use the features that come with this option, including the Descriptive Statistics.
Steps:
➤ First, click on the Data Analysis option, and a list will appear. Choose Descriptive Statistics from the list and click OK.

➤ You will see another new window called Descriptive Statistics. In it, inside the Input Range, select E1 to E13, i.e., the profits. Here, cell E1 is the header. So, check on the Labels in First Row box. Also, make sure Grouped by is selected as Columns.
➤ Now, for the Output Range, select any empty cell. For our dataset, we will select cell F1.
➤ Then, check on Summary Statistics. If you need, you can also check on the Confidence Level for Mean box. Finally, press ok.

➤ The summary statistics will appear in the F column. In it, you can see the mean, median, standard error, mode, maximum value, minimum value, sum, count, etc., elements of the profit of that store.

Explanation of the results
We have got the descriptive statistics of our profit data, and now, we need to interpret the results.
- The Mean
In cell F3, we have the mean profit as $3,587.5. It means the average profit earned by that store per month is 3,587.5 USD regardless of the region.
- Median
Here, we got the median as $3525. It means half of the month’s profits are under this value, and half of them are over this value.
- Mode
We got the mode as N/A. It is because all of our profit values are unique, and so no repetition is noted.
- Standard Deviation
Our profit data showed that it has $580.02 (approx.) standard deviation. This means the profit distribution is spread to $580.02 left and right of our mean ($3,587.5). That is, most of the profit is between $3,007.48 and $4,167.52
Frequently Asked Questions
Can I Perform Descriptive Statistics on Categorical Data Using the Data Analysis ToolPak?
No, you cannot perform descriptive statistics using the Data Analysis Toolpak on categorical data. This feature is designed for only numerical data, as it gives the mean, median, mode, standard deviation, etc. So, if you want to see the descriptives of categorical data, you have to use other functions or features like Pivot Table that support categorical data.
Why Can’t I Use the Data Analysis ToolPak in Excel Online?
This Data Analysis ToolPak is only available for Excel desktop versions. So, you cannot enable or use this feature in the Excel online version. For easier calculations, like the mean, you can do it manually on the Excel online version. But for complex calculations and large datasets, you should use a desktop version of Excel for the descriptive statistics and further analysis.
I Have Enabled the Data Analysis ToolPak, But It Is Not Showing. Why?
First, check again if the Data Analysis ToolPak is enabled properly or not. Go to the File, select Options, scroll down to Add-ins, select Excel Add-ins under the Manage option, and click on Go. In the new window, make sure you check the Analysis ToolPak. Now, go to Data, and you will see the Data Analysis option. If it is not showing even after this, you need to reset the menu ribbon. Just right-click on the upper menu bar and choose Customize ribbon and set it to default. Now, restart Excel, and you will find the Data Analysis tab under the Data section.
Wrapping Up
In this article, we have learned to perform descriptive statistics in Excel with the built-in feature Data Analysis ToolPak. It gives us instant results and makes the analysis or pre-analysis of our dataset easier. We have also explained the important results from the descriptive statistics. Give this a try and let us know if you have any inquiries or if you want to share any feedback.