Understanding how data differs is important whether you’re comparing airline performance, assessing marketing strategies, or summarizing survey findings. Standard error is one such statistic that measures how much the sample mean is likely to deviate from the actual population mean. You can easily calculate standard error in Excel using functions and built in Data Analysis software.
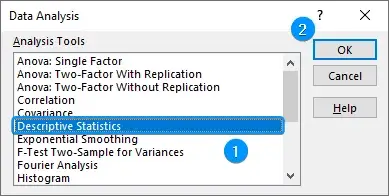
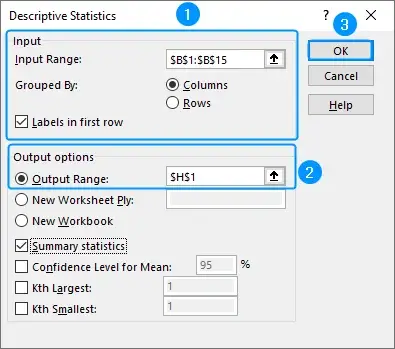
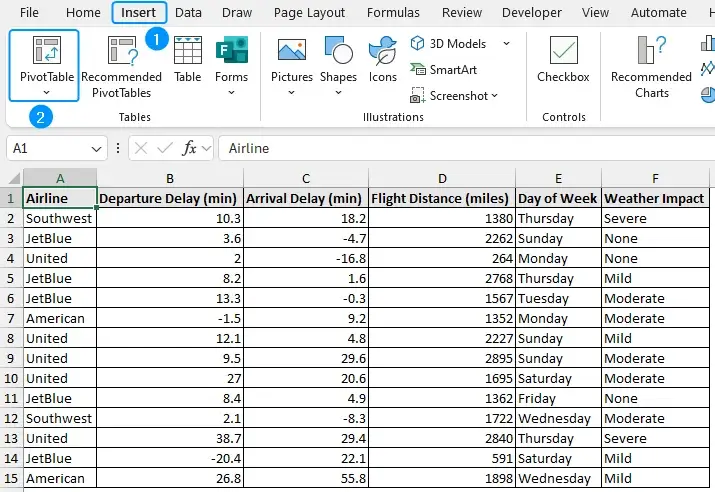
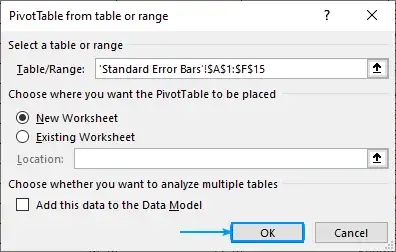
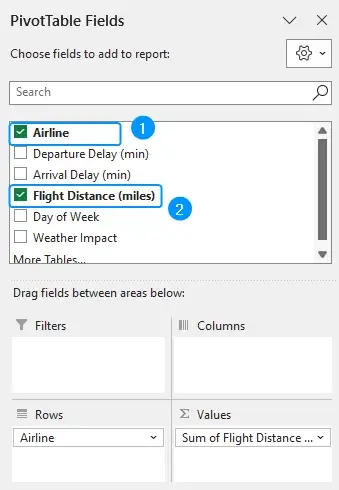
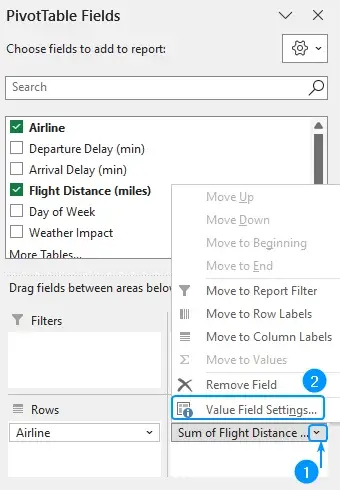
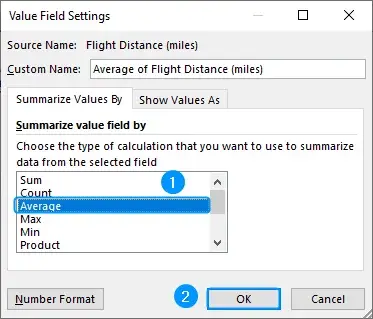
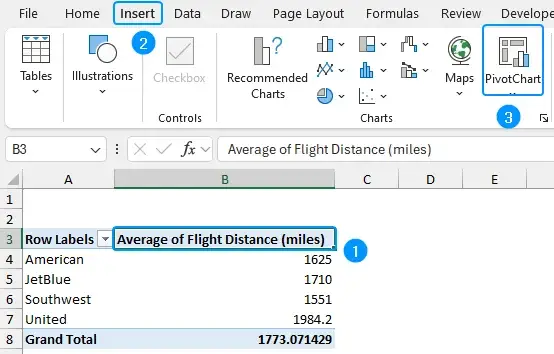
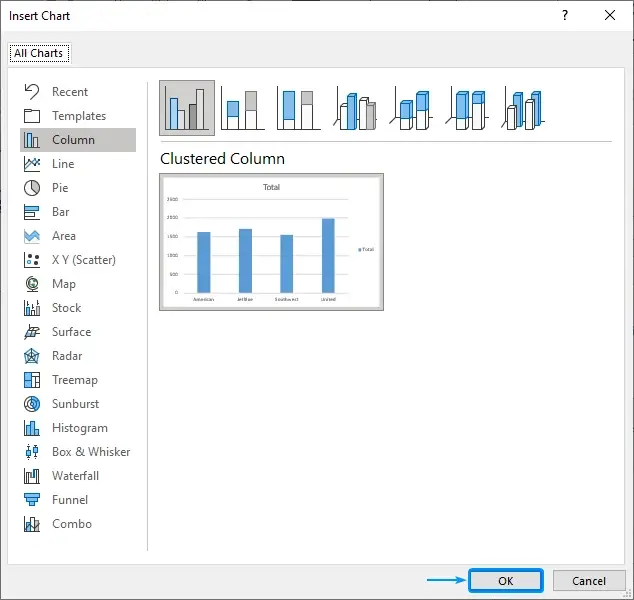
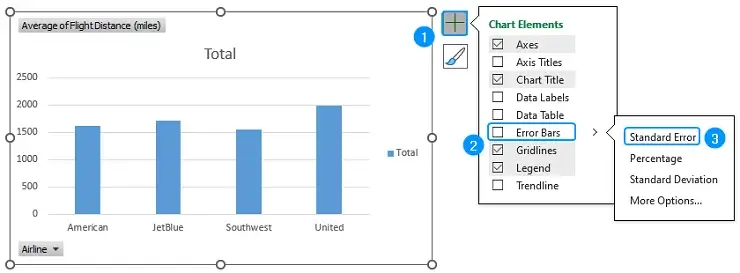
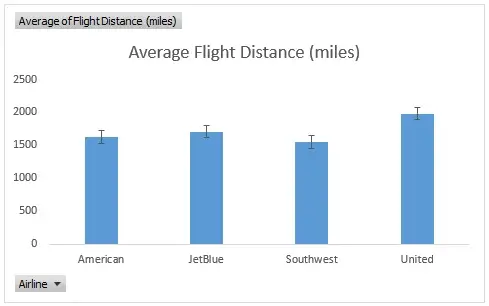
➤ Standard error is the variation of the sample mean from the population mean. In this article, we’ll learn about standard error, how to calculate standard error in Excel using functions and Data Analysis add-in. Also, we’ll learn to add standard error bars in Excel charts and calculate the standard error of estimate. The standard error (SE) or standard error of the mean (SEM) measures the variation of the sample mean from the true population mean. Standard error signifies the accuracy of the sample mean in representing the population mean. Mathematically, the standard error is the ratio of the standard deviation to the square root of the sample size. The airline performance dataset contains the Airline, Departure Delay (min), Arrival Delay (min), Flight Distance (miles), Day of Week, and Weather Impact from columns A through F. The mean arrival delay and the standard error across all the airlines will be calculated. Suppose the mean arrival delay is 8 minutes and the standard error is 3 minutes. On average, flights are delayed by 8 minutes, and if we took several samples and determined the average arrival delay, most of these averages would be within 3 minutes. Let’s calculate the standard error using the STDEV.S, SQRT, and COUNT functions. Steps: ➤ Select the output cell (C17) and enter the formula. ➤ Calculate the standard error of the mean in cell (C18). The Data Analysis ToolPak can be used to calculate the standard error. Before starting, enable the Data Analysis add-in. You’ll find this option in the Data tab. If not, follow these steps: Steps: ➤ Click on the File tab at the top left corner. ➤ Select Options. You can also use the shortcut Alt + F + T to open Excel Options. ➤ Select Add-ins >> Choose Excel Add-ins from the dropdown >> Go. ➤ Check the Analysis ToolPak option >> OK. The Data Analysis option will be available in the Data tab whenever you open a new workbook. ➤ Go to the Data tab >> Click Data Analysis. ➤ Select Descriptive Statistics >> OK. ➤ To calculate the departure delays, select the input range (B1:B15) >> Tick the option Labels in first row. ➤ Choose the output cell (H1) >> Check Summary Statistics >> OK. ➤ Excel returns the summary statistics for the departure delays across all flights. Standard error bars display a likely range where the sample mean lies. We’ll create a chart with standard error bars showing the average distance flown by each airline. Steps: ➤ Move to the Insert tab >> PivotTables. ➤ Click OK to add a PivotTable to a new worksheet. ➤ Add the Airline field in the Rows area and the Flight Distance field in the Values area. ➤ Click the drop down arrow next to the Flight Distance field >> Value Field Settings. ➤ Summarize value field by Average >> OK. ➤Select the Average Flight Distance label >> Insert tab >> Select PivotChart. ➤ Clustered column chart >> OK. ➤ Select the chart >> click on Chart Elements (plus icon) >> Check the Error Bars option >> Standard Error. ➤ Uncheck Gridlines and Legend options >> Add a suitable title. The standard error of estimate measures how accurately the regression model forecasts the values of the dependent variable. It measures the distance between the actual values and the values forecasted by the regression model. In this case, we’ll perform a linear regression to assess how well the departure delay (indepedent variable) predicts the arrival delay (dependent variable). Steps: ➤ Use the STEYX function to calculate the standard error of estimate. Standard error of mean: Uncertainty: Select the Chart >> Click on Chart Elements (plus icon) >> Check Error Bars >> Choose Standard Error. Standard error measures the deviation of the sample mean from the actual population mean. In this tutorial, we’ve learned about the standard error and its calculation using Excel functions and Data Analysis add-in. Moreover, we learned to show standard error bars and calculate the standard error of estimate. Feel free to download the practice file and let us know your preferred method.
➤ Functions: =STDEV.S(cell_reference)/SQRT(COUNT(cell_reference))
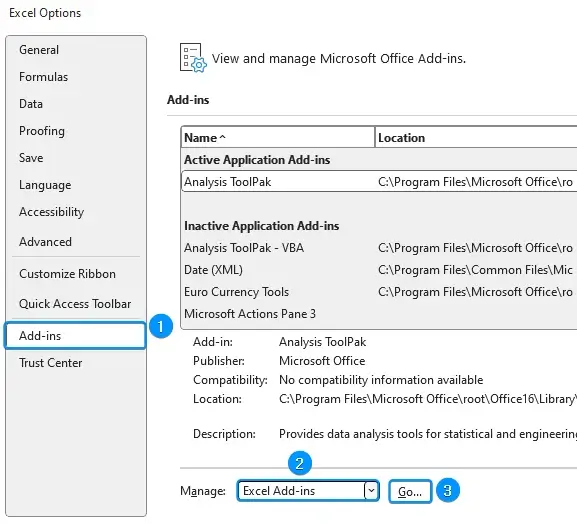
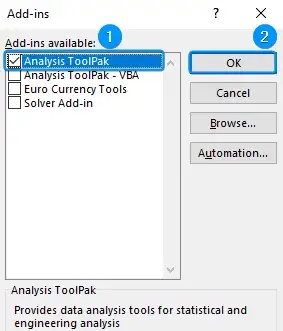
➤ Enable Data Analysis: File >> Options >> Excel Add-ins >> Data Analysis.
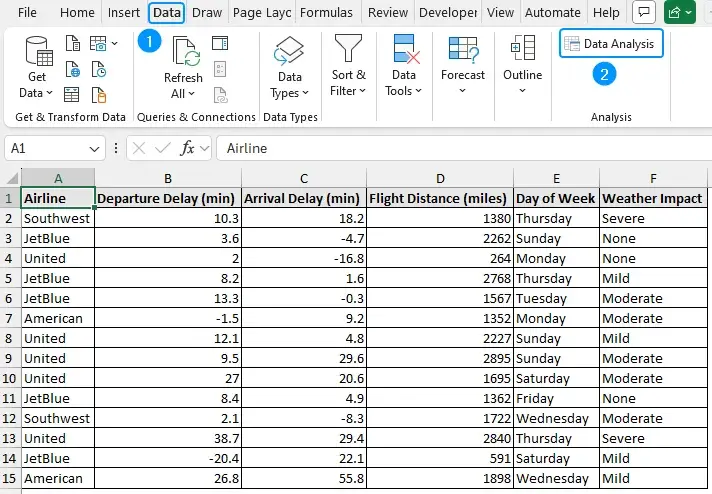
➤ Get standard error: Data tab >> Data Analysis >> Descriptive Statistics >> Input range >> Output range >> Summary Statistics.
➤ PivotTable: Select Data >> Insert >> PivotTable >> Value Field Settings >> Average.
➤ Standard error bars: Select Chart >> Chart Elements >> Error Bars >> standard error.
➤ Standard error of estimate: =STEYX(known_ys,known_xs)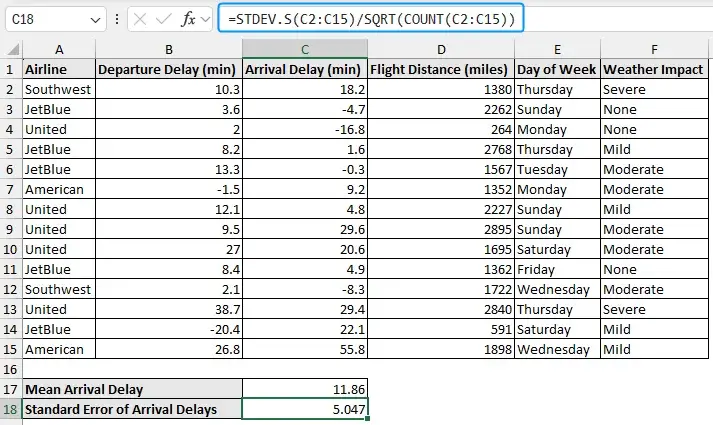
What Is Standard Error in Statistics?
Calculating Standard Error with Excel Functions
=AVERAGE(C2:C15)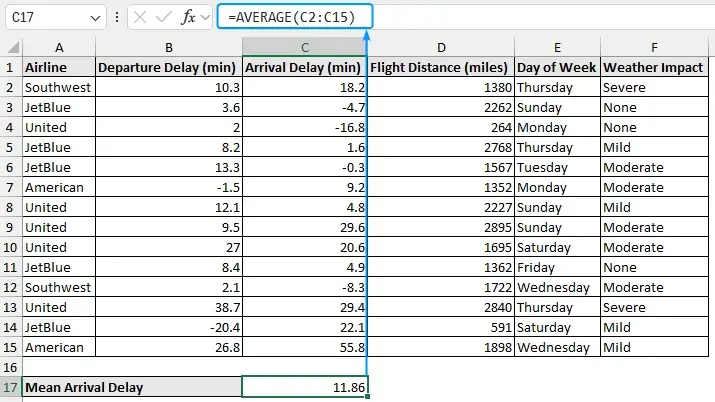
=STDEV.S(B2:B16)/SQRT(COUNT(B2:B16))=STDEV.P(B2:B16)/SQRT(COUNT(B2:B16))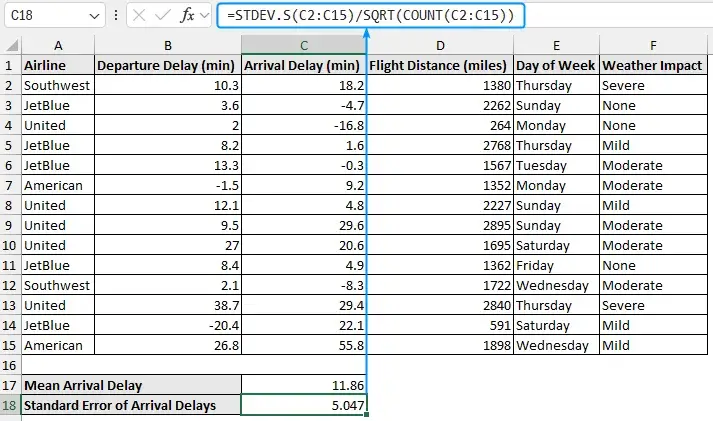
➤ Flights are usually 11.86 minutes late. If we took a few more samples and calculated the average arrival delay, most would fall within 5.05 minutes.Using Data Analysis ToolPak to Calculate Standard Error

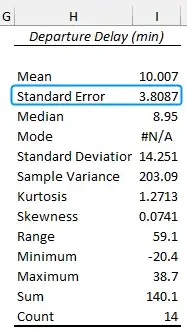
➤ On average, flights are 10.01 minutes late. Calculating a few more samples of the average departure delay, most of these would be within 3.81 minutes.Adding Standard Error Bars
Calculating Standard Error of Estimate in Excel
=STEYX(C2:C15,B2:B15)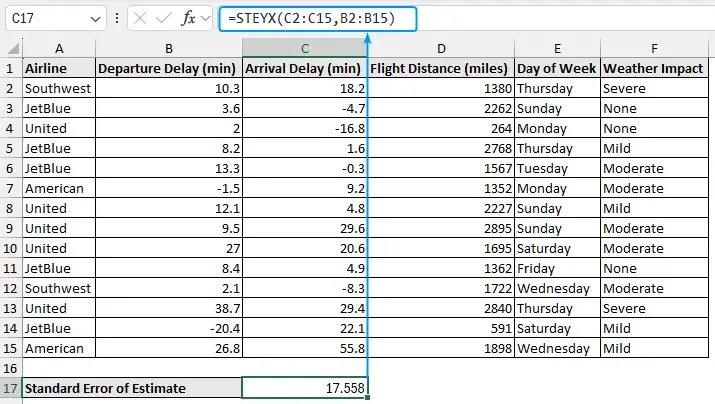
Frequently Asked Questions (FAQs)
How is standard error (SEM) calculated in Excel?
=STDEV.S(cell_reference)/SQRT(COUNT(cell_reference))How do you find uncertainty in Excel?
=STDEV.S(cell_reference)/SQRT(COUNT(cell_reference))How do I add standard error bars in Excel?
How to calculate the standard error of estimate in Excel?
=STEYX(known_ys,known_xs)What is the difference between standard error and standard deviation?
Standard deviation measures how much the individual data points deviate from the mean.Wrapping Up